Candlestick Patterns: Do They Actually Work? (Data Analysis)
Candlestick patterns have been used by traders for over two centuries, originating from Japanese rice markets in the 1700s. Each candlestick encodes four data points — open, high, low, and close — into a visual shape that reveals the battle between buyers and sellers within a given time period. In modern crypto markets, these patterns remain one of the most widely referenced tools for timing entries and exits.
While no pattern predicts the future with certainty, candlestick formations provide probabilistic context. When combined with volume analysis and broader trend structure, they become powerful components of systematic trading strategies that can be rigorously backtested on platforms like StratBase.ai.
Anatomy of a Candlestick
A single candlestick consists of a body (the range between open and close) and wicks (also called shadows, extending to the high and low). A green (bullish) candle closes above its open; a red (bearish) candle closes below. The ratio of body size to wick length communicates conviction:
- Large body, small wicks — strong directional conviction. Buyers (or sellers) controlled the entire session with minimal opposition.
- Small body, long wicks — indecision or rejection of extreme prices. The market tested levels but could not hold them.
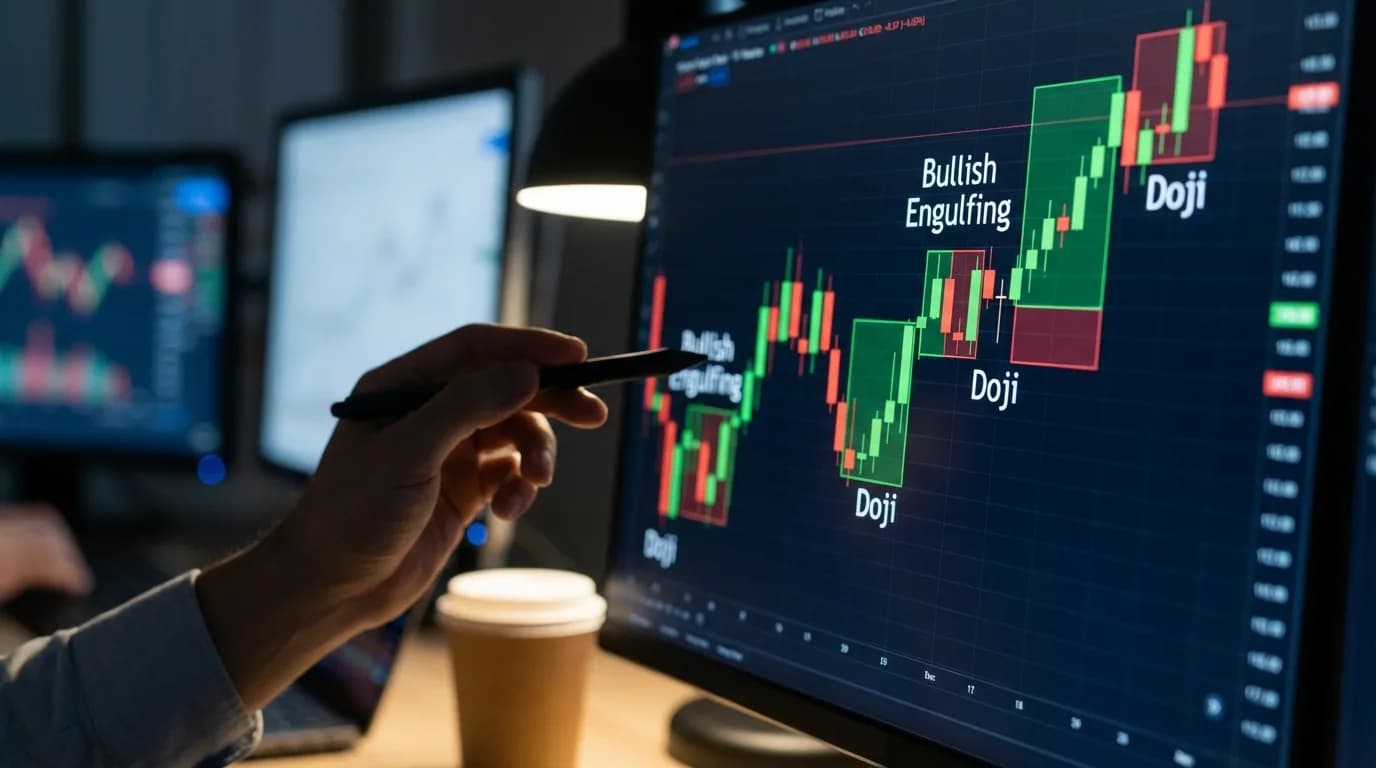
- No body (doji) — equilibrium between buyers and sellers. The open and close are virtually identical, signaling a potential inflection point.
Understanding these building blocks is essential before interpreting multi-candle patterns, because every complex formation is ultimately a sequence of individual candles telling a story about supply and demand.
Key Reversal Patterns
Reversal patterns signal that the current trend may be losing momentum and a directional change is possible. The most widely recognized reversal formations include:
| Pattern | Type | Signal | Confirmation |
|---|---|---|---|
| Hammer | Bullish reversal | Long lower wick, small body at top | Next candle closes above hammer’s high |
| Shooting Star | Bearish reversal | Long upper wick, small body at bottom | Next candle closes below star’s low |
| Engulfing (Bullish) | Bullish reversal | Green candle fully engulfs prior red candle | Volume spike on engulfing candle |
| Engulfing (Bearish) | Bearish reversal | Red candle fully engulfs prior green candle | Occurs at resistance level |
| Morning Star | Bullish reversal | Three-candle: red, small-body, green | Third candle closes above midpoint of first |
| Evening Star | Bearish reversal | Three-candle: green, small-body, red | Third candle closes below midpoint of first |
| Piercing Line | Bullish reversal | Green candle opens below prior red’s low, closes above midpoint | Volume expansion on the piercing candle |
| Dark Cloud Cover | Bearish reversal | Red candle opens above prior green’s high, closes below midpoint | Occurs after sustained uptrend |
The reliability of reversal patterns increases significantly when they appear at established support or resistance levels, especially when confirmed by elevated volume.
Continuation Patterns
Not all patterns signal reversals. Some confirm that an existing trend is likely to persist:
- Three White Soldiers — three consecutive bullish candles with progressively higher closes, indicating sustained buying pressure. Each candle should open within the prior candle’s body.
- Three Black Crows — the bearish counterpart: three red candles with progressively lower closes, signaling relentless selling pressure.
- Rising Three Methods — a long bullish candle, followed by three small bearish candles contained within its range, then another long bullish candle. This consolidation within a trend suggests continuation rather than reversal.
- Falling Three Methods — the bearish mirror: a long red candle, three small bullish candles within its range, then another long red candle confirming the downtrend.
Continuation patterns are particularly valuable because they help traders add to existing positions during pullbacks rather than chasing breakouts at extended prices.
Candlestick Patterns in Crypto Markets
Crypto markets exhibit unique characteristics that affect pattern reliability. The 24/7 trading cycle means there are no opening gaps on intraday timeframes, which reduces the significance of gap-based patterns like the morning star on lower timeframes. However, on daily and weekly charts, weekend liquidity differences can create meaningful gaps that enhance pattern significance.
Volatility in crypto is substantially higher than in traditional markets. A «long wick» on BTC might represent a 3–5% move, whereas in equities it might be 0.5%. This means traders should calibrate their expectations: pattern targets and stop-loss distances need to account for crypto-specific volatility ranges. Using ATR (Average True Range) as a multiplier for stops and targets normalizes pattern-based strategies across different volatility environments.
Timeframe selection also matters. On 1-minute charts, candlestick patterns are mostly noise. On 4-hour and daily charts, they carry more weight because each candle represents a larger aggregation of market participant decisions. Most systematic studies find the highest signal-to-noise ratio on 4H, daily, and weekly timeframes for pattern-based entries.
A candlestick pattern without context is just a shape on a chart. The same hammer at a major support level after a 30% decline carries far more significance than one appearing mid-range during low-volume consolidation.
Backtesting Candlestick Strategies
The real value of candlestick patterns emerges when they are tested systematically. Instead of relying on anecdotal observations, traders can quantify pattern performance across thousands of historical occurrences. Key questions to answer through backtesting:
- What is the win rate of bullish engulfing patterns on BTC/USDT 4H over the past three years?
- Does adding a volume filter (above 20-period average) improve the pattern’s reliability?
- What is the optimal take-profit distance relative to the pattern’s range?
- How does pattern performance vary across market regimes — trending versus ranging?
- Do multi-candle patterns (morning star, three soldiers) outperform single-candle patterns (hammer, doji) in terms of risk-adjusted returns?
StratBase.ai’s engine includes 61 pattern-recognition indicators that can detect candlestick formations automatically and incorporate them into strategy conditions. This allows traders to combine patterns with technical indicators, time filters, and risk management rules in a single backtest — testing hundreds of combinations in minutes rather than months of manual observation.
Rather than debating which patterns «work,» evidence-based traders let the data decide — and adjust their strategies accordingly.
Further Reading
About the Author
Financial data analyst focused on crypto derivatives and on-chain metrics. Expert in futures market microstructure and funding rate strategies.
FAQ
Do candlestick patterns actually predict price movement?▾
In isolation, most candlestick patterns have weak predictive value — barely above random chance. Studies show single-candle patterns (doji, hammer, shooting star) predict direction at 51-53% accuracy, only marginally better than a coin flip. However, patterns combined with context (trend direction, support/resistance, volume) show stronger results: 55-60% accuracy for multi-candle patterns at key levels.
Which candlestick patterns are most reliable?▾
Research consistently identifies three-candle reversal patterns as most reliable: morning star/evening star (55-58% accuracy at support/resistance), and engulfing patterns at trend extremes (54-57%). Single-candle patterns like doji and hammer are least reliable alone. The key factor isn't the pattern itself but WHERE it appears — at support/resistance levels with trend exhaustion.
Should I use candlestick patterns in my trading strategy?▾
Yes, but as a FILTER, not a primary signal. Use trend indicators (EMA, ADX) for direction, momentum indicators (RSI) for timing, and candlestick patterns for CONFIRMATION at key levels. A bullish engulfing at a support level with RSI oversold is a high-quality signal. A bullish engulfing in the middle of a downtrend with no support is noise.
Comments (0)
Loading comments...