Grid Trading Strategy: Complete Guide With Backtest
Grid trading is one of the oldest automated strategies in finance, predating modern algorithmic trading by decades. The concept is deceptively simple: place a grid of limit orders above and below the current price. As price moves up and down through the grid, orders fill and generate small profits on each oscillation. Grid bots have become enormously popular in crypto, where high volatility and 24/7 markets create ideal conditions for range trading. But grids carry hidden risks that most promotional content glosses over.
How Grid Trading Works
A basic grid setup on BTC at $60,000:
- Define the range: $55,000 to $65,000
- Set the grid spacing: $500 (or 20 grid levels)
- Place buy orders below current price: $59,500, $59,000, $58,500, etc.
- Place sell orders above current price: $60,500, $61,000, $61,500, etc.
- When a buy fills (e.g., at $59,000), immediately place a sell order one grid level above ($59,500)
- When that sell fills, the $500 difference (minus fees) is profit
Each completed buy-sell cycle generates the grid spacing as gross profit. With 20 grid levels and 0.075% fees per side, each cycle nets about $500 - $90 = $410 per unit. If price bounces between all 20 levels multiple times, the profits accumulate.
Grid Types
Symmetric Grid
Equal spacing between all grid levels (e.g., every $500). Simple to set up. Works well in symmetric ranges where price is equally likely to move up or down from center.
Arithmetic vs. Geometric
Arithmetic grids use fixed dollar spacing ($500 between each level). Geometric grids use fixed percentage spacing (1% between each level). For crypto, geometric grids are generally better because they maintain consistent percentage returns per cycle regardless of price level.
Long Grid vs. Short Grid
A long grid only places buy orders below current price (no sells above). Profits come from buying dips and selling when price returns to entry. This is a bullish grid suitable for uptrending assets. A short grid does the reverse. The neutral grid (both buys and sells) is the standard range-trading version.
Backtest Results
We backtested a symmetric geometric grid (1% spacing) on BTC/USDT 1H data for different market phases:
| Market Phase | Duration | Grid Return | Buy-Hold Return |
|---|---|---|---|
| Range (May-Sep 2023) | 5 months | +14.2% | +3.1% |
| Uptrend (Oct 2023-Mar 2024) | 6 months | +8.4% | +112% |
| Downtrend (Apr-Jul 2022) | 4 months | -34.1% | -52.8% |
| Choppy uptrend (Q1 2021) | 3 months | +22.8% | +89% |
The pattern is clear: grids dominate in ranges (14.2% vs 3.1%), underperform dramatically in strong trends (8.4% vs 112%), and lose less than buy-and-hold in downtrends (-34.1% vs -52.8%) because the grid sells into strength on the way down. The ideal grid market is a volatile range — lots of oscillation, no sustained direction.
Optimal Grid Settings
Grid Spacing
Tighter spacing (0.5%) means more cycles but each cycle profits less (and fees consume a larger percentage). Wider spacing (2%) means fewer but more profitable cycles. The optimal spacing depends on the instrument's typical oscillation:
- BTC: 0.8-1.2% geometric spacing on 1H data
- ETH: 1.0-1.5% (more volatile)
- Major altcoins: 1.5-2.5% (much more volatile)
- Stablecoins (USDT/USDC): 0.02-0.05% (used for stablecoin arbitrage)
Range Selection
The range should encompass the instrument's expected price movement for the grid period. Using the ATR-based approach: Range = Current Price ± (Daily ATR × Expected Days). For a 30-day BTC grid with $2,000 daily ATR: Range ≈ $60,000 ± $8,000 → $52,000-$68,000.
A range that's too narrow gets breached frequently (grid stops working). A range that's too wide means grid levels are far apart and few cycles complete. The ATR-based approach provides a data-driven starting point.
Risk Management
The worst-case scenario for a grid: price falls below the lowest grid level and keeps falling. You're now holding positions at every grid level above with unrealized losses. The maximum loss equals the total capital invested across all grid levels times the percentage decline below your average entry.
Mitigations:
- Global stop loss: If price drops X% below the grid range, close all positions. This caps total loss but guarantees a large realized loss.
- Grid size limit: Don't allocate more than 20-30% of total capital to any single grid. Keep reserves for range expansion or other opportunities.
- Trend filter: Only run grids when ADX < 20 (no trend). Disable the grid when ADX > 25 (trend forming).
Grid Trading on StratBase
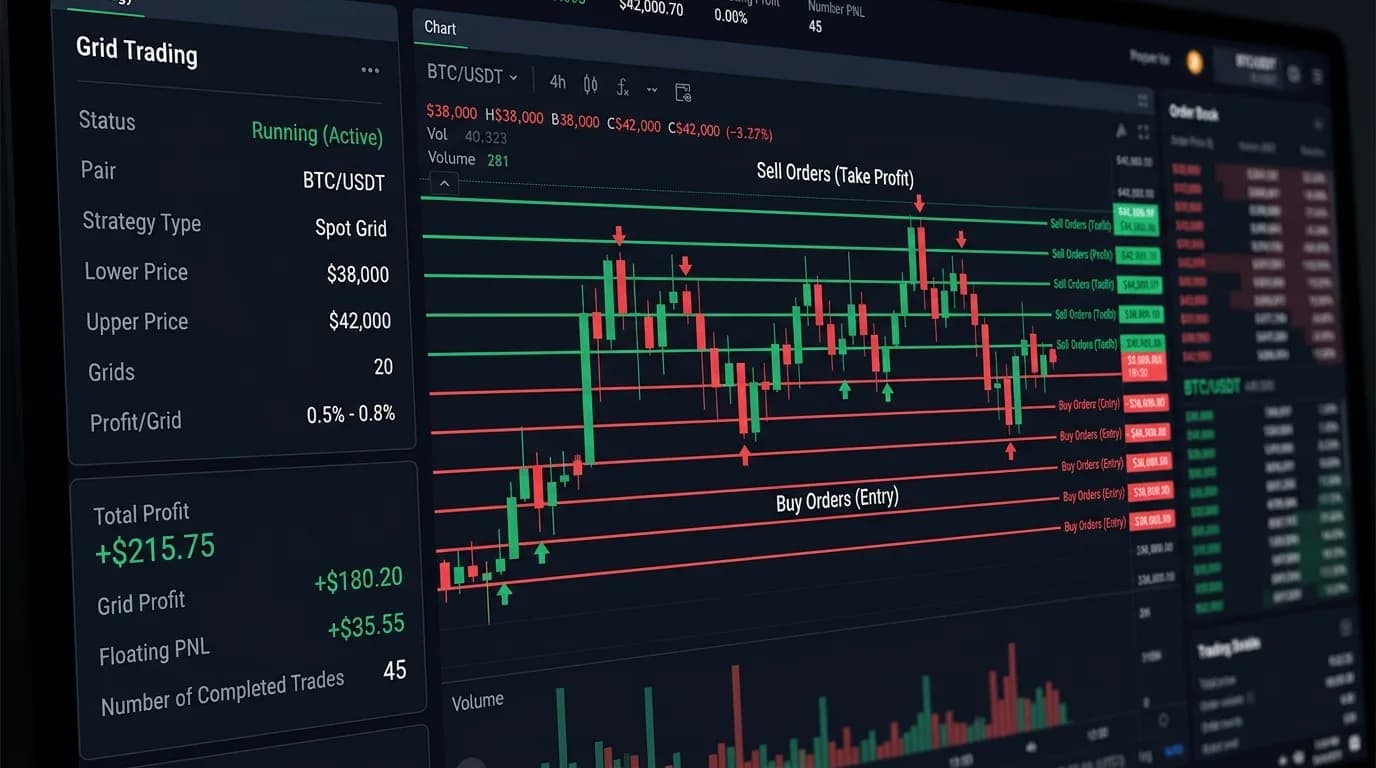
StratBase.ai's backtesting engine supports grid strategies with configurable levels, spacing, and range. The grid fill visualization shows each buy and sell execution on the chart, with take-profit levels recalculating from the average entry after each fill. This allows you to test different grid configurations on historical data before deploying real capital.
Backtest grid strategies with real data
StratBase.ai supports grid trading with configurable spacing, range, and risk parameters. See exactly how your grid would have performed. Build your grid →
What is grid trading?
A ladder of buy and sell orders at fixed intervals. Profits from price oscillating within a range — each buy-sell cycle captures the grid spacing as profit. Works like a systematic range-trading machine.
When does grid trading work?
In ranging markets with high oscillation. BTC grid returned +14.2% in a range vs +3.1% buy-hold. Underperforms in strong trends (+8.4% vs +112%). Best when ADX < 20.
What is the biggest grid risk?
Sustained breakout below the grid range. You hold positions at every level with unrealized losses. Mitigate with global stop loss, capital limits (20-30%), and ADX-based trend filter.
Further Reading
About the Author
Quantitative researcher with 8+ years in algorithmic trading and strategy backtesting. Specializes in technical indicator analysis and risk-adjusted performance metrics.
FAQ
What is grid trading?▾
Grid trading places a ladder of buy and sell orders at fixed price intervals. As price oscillates within a range, the grid automatically buys low at lower grid levels and sells high at upper levels. Each completed buy-sell cycle captures the grid spacing as profit. It works like a systematic range-trading machine.
When does grid trading work?▾
Grid trading profits in ranging (sideways) markets where price oscillates within a defined range. The more price bounces between grid levels, the more profit the grid generates. It works best during consolidation phases, accumulation ranges, and on instruments with high mean-reversion tendency. BTC has shown 40-60% of its time in ranging conditions suitable for grids.
What is the biggest risk of grid trading?▾
A sustained breakout beyond the grid's range. If price drops below the lowest grid level, you're fully allocated with unrealized losses at every grid buy level. If price rises above the highest level, you've sold all your position and miss the continuation. The max loss occurs when price drops to zero from your average grid entry price — similar to the risk of a DCA strategy that keeps buying into a crash.
Further reading
Related articles
Comments (0)
Loading comments...