Stochastic Oscillator: How to Trade Overbought and Oversold
George Lane developed the Stochastic oscillator in the 1950s based on a simple observation: in uptrends, closing prices tend to cluster near the high of the range, and in downtrends, near the low. The Stochastic quantifies this behavior on a 0–100 scale. It remains one of the most widely used momentum indicators, appearing in strategies across stocks, forex, and crypto. But what does the data actually show about its effectiveness?
How the Stochastic Works
The calculation is straightforward. The %K line measures where the current close sits relative to the highest high and lowest low over a lookback period:
%K = ((Close - Lowest Low) / (Highest High - Lowest Low)) × 100
The %D line is simply a moving average of %K, typically a 3-period SMA. When you hear "14,3,3 Stochastic," this means:
- 14 = the lookback period for the high-low range
- 3 = the smoothing applied to %K (often called "slow %K")
- 3 = the period for the %D moving average
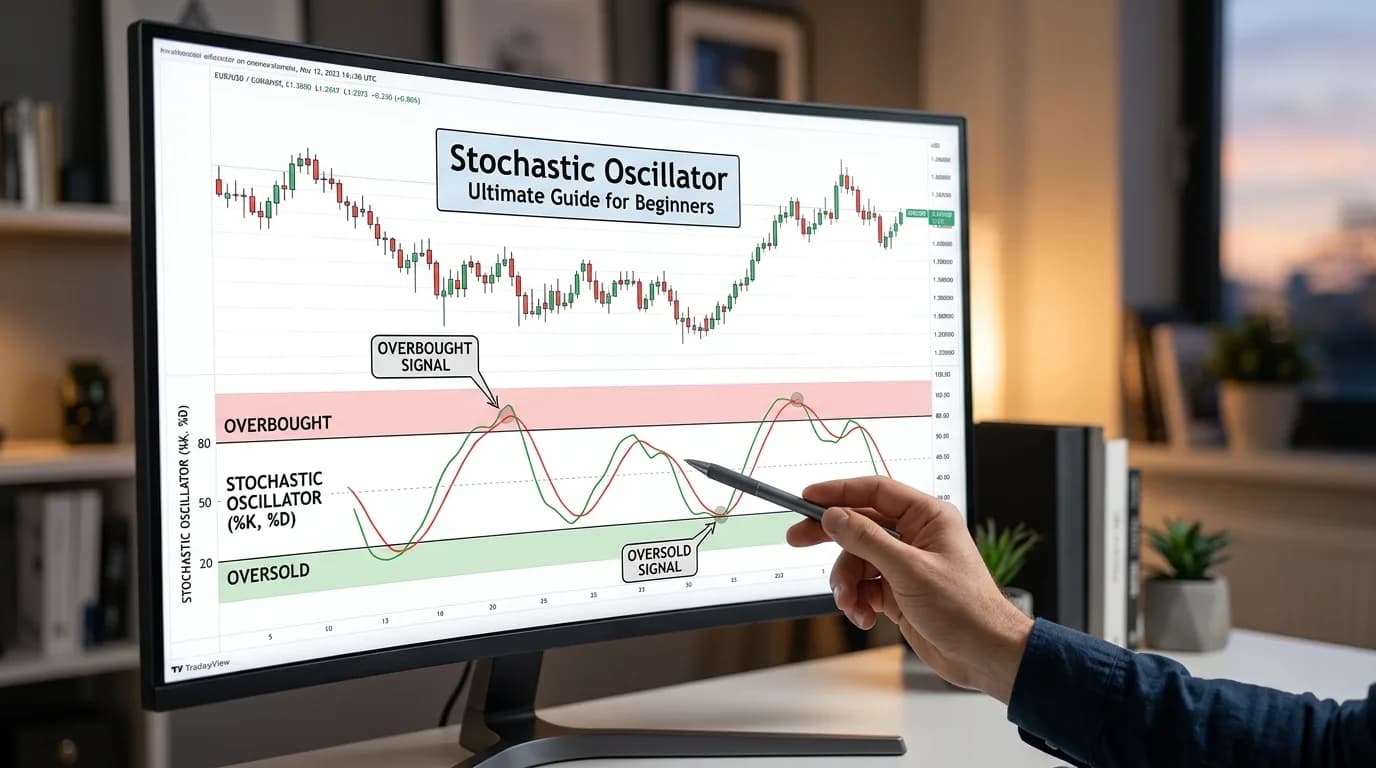
The result is two lines oscillating between 0 and 100. A reading of 80 or above is traditionally labeled "overbought," while 20 or below is "oversold." Horizontal reference lines at these levels are standard on most charting platforms.
Fast vs. Slow Stochastic
The raw %K is extremely volatile — it jumps with every candle. This is the "fast" Stochastic. Most traders use the "slow" version, which applies the first smoothing to %K. On StratBase.ai, the Stochastic indicator defaults to the slow version (14,3,3), which is the standard in professional charting software.
The full Stochastic adds a second smoothing to %K, making it even smoother. It's less common in practice because the slow Stochastic already filters enough noise for most timeframes.
Trading Signals
1. Overbought/Oversold Crossovers
The classic signal: buy when the Stochastic crosses above 20 from below (leaving oversold), sell when it crosses below 80 from above (leaving overbought). This approach works best in ranging markets where price oscillates between support and resistance.
In our backtest of this simple strategy on BTC/USDT 4H (2021-2024), the oversold crossover generated 127 long signals with a 49% win rate and a profit factor of 0.94. By itself, the signal is not profitable after fees — it needs additional filters.
2. %K/%D Crossovers
Buy when %K crosses above %D, sell when %K crosses below %D. This is a faster signal than the overbought/oversold crossover, but produces more noise. Filtering these crossovers to only count when they occur in the overbought or oversold zone significantly improves the signal quality.
In the same BTC/USDT 4H dataset, %K crossing above %D while both were below 20 produced 43 signals with a 57% win rate and a profit factor of 1.28 — a meaningful improvement over the basic approach.
3. Stochastic Divergence
Bullish divergence occurs when price makes a lower low but the Stochastic makes a higher low. This suggests momentum is shifting despite price continuing down. Bearish divergence is the reverse — higher price high, lower Stochastic high.
Divergence signals are rarer but more potent. The challenge is that they're subjective to identify visually and harder to code precisely. On StratBase.ai, you can use the divergence condition type to automate this detection and test it across different instruments and timeframes.
4. Bull/Bear Setups
Lane himself considered these the most important patterns. A bull setup occurs when the Stochastic makes a lower high (below 50) followed by a higher low. A bear setup is a higher low (above 50) followed by a lower high. These are intermediate patterns that signal the next move's direction.
The Overbought/Oversold Trap
The single biggest mistake traders make with the Stochastic is treating overbought as "time to sell" and oversold as "time to buy." In strong trends, the Stochastic can remain above 80 for weeks — selling every time it reaches 80 in a bull trend is a recipe for pain.
The correct interpretation: overbought means momentum is strong (price keeps closing near the top of its range). It only becomes a sell signal when the Stochastic turns down from the overbought zone, ideally with price failing to make a new high (divergence).
"The Stochastic doesn't tell you price is too high or too low — it tells you where price is closing relative to its range. In a strong uptrend, closing near the top of the range is normal, not a warning."
Combining Stochastic With Trend Filters
The Stochastic performs dramatically better when filtered by trend. A common approach is to only take oversold buy signals when price is above the 200-period moving average (or above the Ichimoku cloud), and only take overbought sell signals when price is below.
| Strategy | Signals | Win Rate | Profit Factor |
|---|---|---|---|
| Stochastic alone (oversold cross) | 127 | 49% | 0.94 |
| Stochastic + 200 SMA filter | 68 | 56% | 1.31 |
| Stochastic + RSI confirmation | 41 | 59% | 1.45 |
| Stochastic %K/%D cross in zone + 200 SMA | 29 | 62% | 1.58 |
Each additional filter reduces the number of signals but improves the quality. The last row — %K/%D cross in the oversold zone with a 200 SMA trend filter — produced the best risk-adjusted returns in our testing, with only 29 signals but a solid 1.58 profit factor.
Settings by Market and Timeframe
The default 14,3,3 is a reasonable starting point for 4H and daily charts. For lower timeframes (15m, 1H), shortening to 5,3,3 or 8,3,3 provides more responsive signals. For weekly charts or very long-term analysis, 21,5,5 reduces noise.
Crypto's higher volatility means the Stochastic whipsaws more frequently than on forex. Using a slightly longer lookback (21 instead of 14) on crypto 4H charts can help, or stick with 14,3,3 but require the signal to hold for 2 candles before acting.
Stochastic vs. RSI
Both are momentum oscillators, but they measure different things. RSI measures the speed and magnitude of price changes. The Stochastic measures the position of the close within the high-low range. RSI is smoother and better for identifying overall momentum shifts. The Stochastic is faster and better for pinpointing entry timing within a trend.
Many traders use both together — RSI to confirm the trend direction, Stochastic to time the entry. This combination reduces false signals from either indicator used alone.
Backtest Stochastic strategies with real data
Configure %K, %D, and smoothing periods on StratBase.ai. Combine with trend filters and see the impact on performance. Try it free →
What is the Stochastic oscillator?
A momentum indicator that compares a security's closing price to its price range over a given period. It produces two lines — %K and %D — oscillating between 0 and 100.
What do overbought and oversold mean?
Overbought (above 80) means price is closing near the top of its recent range. Oversold (below 20) means the bottom. These are not automatic reversal signals — in strong trends, the Stochastic can stay in these zones for extended periods.
What are the best Stochastic settings?
Default 14,3,3 works well for swing trading. For faster signals on lower timeframes, try 5,3,3. For fewer false signals on daily charts, 21,5,5 filters more noise.
Further Reading
About the Author
Financial data analyst focused on crypto derivatives and on-chain metrics. Expert in futures market microstructure and funding rate strategies.
FAQ
What is the Stochastic oscillator?▾
The Stochastic oscillator is a momentum indicator that compares a security's closing price to its price range over a given period. It produces two lines — %K (fast) and %D (slow, a moving average of %K) — that oscillate between 0 and 100.
What do overbought and oversold mean on the Stochastic?▾
Overbought (above 80) means price is closing near the top of its recent range. Oversold (below 20) means price is closing near the bottom. These are not automatic reversal signals — in strong trends, the Stochastic can remain overbought or oversold for extended periods.
What are the best Stochastic settings?▾
The default 14,3,3 (14-period %K, 3-period %K smoothing, 3-period %D) works well for most swing trading. For faster signals, 5,3,3 is popular on lower timeframes. For fewer false signals, 21,5,5 filters more noise on daily charts.
Related articles
Comments (0)
Loading comments...