What Is Backtesting? Complete Guide for Beginners
Imagine you have a trading idea: “Buy Bitcoin when the RSI drops below 30 and sell when it rises above 70.” Sounds logical. But does it actually make money? You have two options: trade it live and find out the expensive way, or test it against years of historical data and find out in seconds. Backtesting is the second option. It's the single most important tool for separating strategies that work from strategies that only sound like they should work.
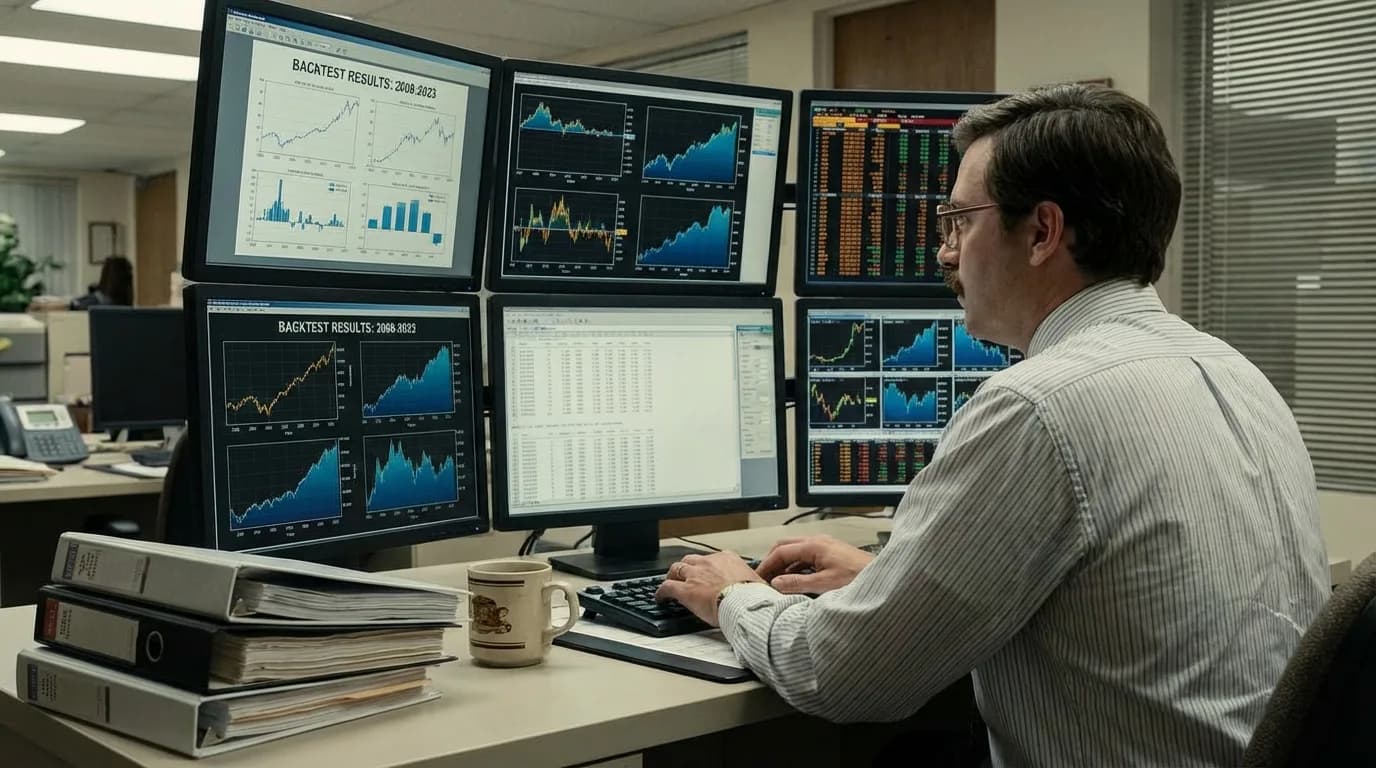
Backtesting in Plain English
Backtesting means running your trading rules against historical price data to see what would have happened. The engine scrolls through every candle — day by day, hour by hour — and asks: “Do the entry conditions match?” When conditions match, it simulates a trade. When exit conditions or stops are hit, it closes the trade. At the end, it tallies all wins and losses.
The result: concrete numbers. Not “I think this strategy works” but “this strategy produced a 54% win rate, 1.6 profit factor, and 22% maximum drawdown over 1,247 trades from 2020 to 2025.”
Why Every Trader Needs Backtesting
1. Most Ideas Don't Work
The majority of trading ideas that “make sense” logically produce negative results when tested. A strategy can be based on sound reasoning and still lose money due to timing, costs, or conditions you didn't anticipate. Backtesting reveals this before your account does.
2. Your Memory Is Unreliable
You remember the time RSI below 30 preceded a perfect bounce. You forget the three times it continued dropping. Human memory is biased toward vivid events — and winning trades are more vivid than losing ones. Backtesting counts all trades equally, providing an unbiased record.
3. Statistics Beat Intuition
A strategy might “feel” profitable because you recall several big wins. But if the average loser is 3× the average winner, the overall expectancy is negative. Only systematic testing across hundreds of trades reveals the true statistical profile of a strategy.
What Backtesting Shows You
| Metric | What It Tells You | Good Value |
|---|---|---|
| Win Rate | Percentage of trades that profit | 40–60% (depends on R:R) |
| Profit Factor | Gross profit / Gross loss | Above 1.5 |
| Max Drawdown | Worst peak-to-trough decline | Below 25% |
| Sharpe Ratio | Risk-adjusted return consistency | Above 1.0 |
| Total Trades | Statistical sample size | 200+ for reliable results |
| Expectancy | Average profit per trade | Positive (after costs) |
How Backtesting Works: Step by Step
Step 1: Define your strategy. Specific entry conditions, exit conditions, stop-loss, take-profit, and position sizing. “Buy when X happens, sell when Y happens, stop at Z.”
Step 2: Choose your data. Which instrument? What timeframe? What date range? More data means more trades and more reliable statistics.
Step 3: Run the simulation. The backtesting engine processes each candle, applying your rules. When entry conditions are met, a simulated trade opens. When exit conditions or stops are hit, the trade closes.
Step 4: Analyze results. Review the metrics. Is the profit factor above 1.5? Is the max drawdown survivable? Are there enough trades for statistical significance?
Step 5: Iterate. If results are poor, adjust your rules. Change parameters. Add filters. Remove unnecessary conditions. Test again.
Backtesting vs Paper Trading vs Live Trading
These three methods serve different purposes and answer different questions. Understanding where each one fits prevents both premature live trading and endless testing paralysis.
| Method | Speed | Cost | Realism | Best For |
|---|---|---|---|---|
| Backtesting | Seconds–minutes | Free | Moderate | Strategy discovery and initial validation |
| Paper trading | Real-time (weeks) | Free | High | Execution testing, psychological readiness |
| Live trading | Real-time | Real capital at risk | Maximum | Generating actual returns |
Backtesting tells you whether an idea has statistical merit. Paper trading tests whether you can execute consistently in real-time — handling live markets and sticking to the plan during drawdowns. Live trading introduces real financial consequences that affect decision-making in ways paper trading cannot replicate.
The ideal progression: backtest to validate the concept, paper trade for 2–4 weeks, then transition to live trading with reduced position sizes.
Limitations of Backtesting
Backtesting is powerful, but recognizing its boundaries prevents overconfidence:
Past performance does not guarantee future results. A strategy with 60% annual returns from 2020–2025 may underperform if the market regime shifts.
Execution reality is absent. A backtest fills orders at the candle's close price. Real trading involves slippage, partial fills, and latency between signal and execution.
Emotional factors are invisible. A backtest doesn't flinch during a −30% drawdown. You will. The best strategy is useless if you can't execute it during painful periods.
Common Backtesting Mistakes
Overfitting: Optimizing until the backtest looks perfect on past data, producing results that fail in real trading.
Look-ahead bias: Using information that wouldn't have been available at the trade time (e.g., same-candle execution).
Ignoring costs: Not accounting for commissions and slippage, which can erase slim edges.
Too few trades: Drawing conclusions from 20–30 trades, where random chance dominates.
Getting Started with Your First Backtest
You don't need to code. StratBase.ai lets you describe your trading idea to an AI assistant, which translates it into a complete strategy. The Rust engine tests it against years of real market data in seconds.
A practical path for your first backtest:
- Pick one liquid instrument. BTC/USDT for crypto, EUR/USD for forex, SPY for stocks.
- Choose a simple strategy. One entry condition (RSI below 30) and basic exits (3% stop loss, 6% take profit).
- Use at least 2 years of data. This covers different market conditions and gives enough trades for statistical significance.
- Review the key metrics. Profit factor (above 1.3), total trades (above 50), and max drawdown (below 30%).
- Change one parameter at a time. Adjust RSI from 30 to 25, compare. Then change stop loss from 3% to 4%, compare. Systematic iteration builds understanding.
Further Reading
About the Author
Quantitative researcher with 8+ years in algorithmic trading and strategy backtesting. Specializes in technical indicator analysis and risk-adjusted performance metrics.
FAQ
What is backtesting in trading?▾
Backtesting is testing a trading strategy against historical market data to evaluate how it would have performed. You define entry rules, exit rules, and risk parameters, then a backtesting engine simulates executing those rules across months or years of past price data. The result shows win rate, profit factor, maximum drawdown, and other metrics that indicate whether the strategy has a genuine edge.
Why is backtesting important?▾
Backtesting prevents the most expensive way to test a strategy: losing real money. Without backtesting, you're essentially gambling — you don't know your strategy's win rate, expected drawdown, or whether it's profitable at all. Backtesting provides statistical evidence before you risk capital, showing expected performance across hundreds of trades and multiple market conditions.
How accurate is backtesting?▾
Backtesting is as accurate as its methodology. Well-conducted backtests (next-bar execution, realistic costs, multiple market regimes) provide reliable estimates of strategy behavior. Common errors that reduce accuracy include: look-ahead bias (using future data), ignoring trading costs, overfitting to historical data, and insufficient sample size. Professional backtests include cost modeling and out-of-sample validation to ensure accuracy.
Related articles
Comments (0)
Loading comments...