10 Common Backtesting Mistakes That Destroy Your Edge
Backtesting is the closest thing trading has to a scientific method. You form a hypothesis (strategy), design an experiment (backtest rules), run the test (historical data), and analyze results. But just like in science, methodological errors invalidate results. These 10 backtesting mistakes are so common that the majority of "profitable backtests" circulating online are meaningless. Avoiding them separates traders who learn from data from traders who deceive themselves with it.
Mistake #1: Overfitting Parameters
You test RSI with a 14-period setting — profit factor 1.3. Not great. You try 12 — profit factor 1.5. Better. You try 11 — profit factor 1.8. 10.5 periods — profit factor 2.1. You've now "optimized" RSI to 10.5 periods and declared your strategy superior.
What actually happened: you searched through dozens of parameter values until you found one that happened to fit the random noise in your specific historical data. The 10.5-period setting doesn't capture a real market dynamic — it captured a statistical artifact. In live trading, the noise pattern will be different, and performance reverts to mediocre or worse.
Fix: Use robust parameters (round numbers that are widely used), test in-sample and validate out-of-sample, and be suspicious of any strategy that only works with very specific parameter values.
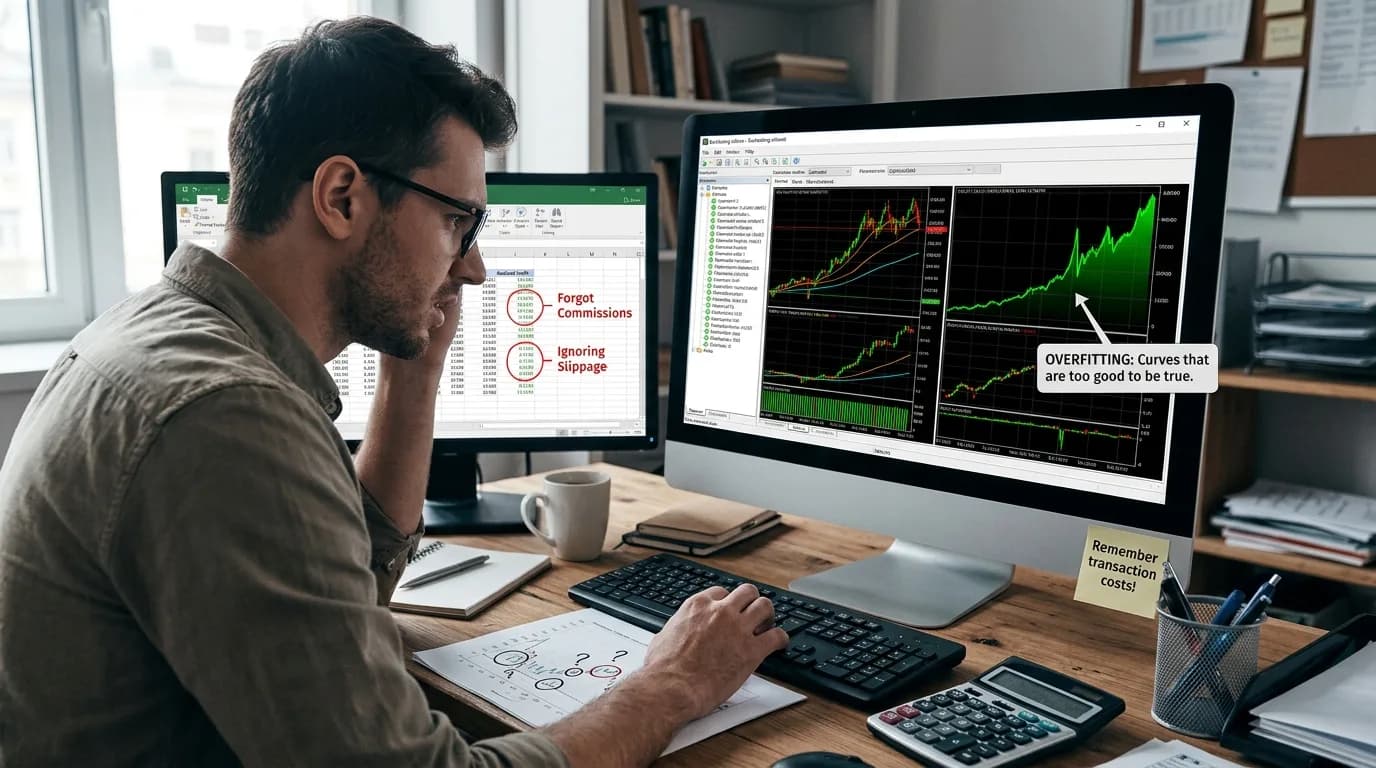
Mistake #2: Ignoring Trading Costs
A strategy that trades 20 times per day with 0.2% average return per trade looks profitable. But add 0.1% commission per trade (typical for crypto), and 20 trades × 0.1% × 2 (entry + exit) = 4% daily cost. Your 20 × 0.2% = 4% gross return becomes 0% net return. You just paid the exchange to break even.
Many backtests ignore commissions, slippage, and funding rates entirely. Others include commission but ignore slippage, which can equal or exceed commission costs in volatile markets.
Fix: Always include commissions in backtests. Add 0.05-0.1% slippage per trade for liquid instruments and 0.2-0.5% for illiquid ones. If the strategy's edge disappears after costs, it wasn't a real edge.
Mistake #3: Look-Ahead Bias
Using information that wouldn't have been available at the trade decision time. The most common form: using the daily close price for a calculation that should be made during the day. If your entry rule says "buy when daily RSI < 30," you can't know that RSI will close below 30 until the candle closes. During the day, RSI might dip below 30 and recover above it by close.
Subtler forms include: selecting instruments based on future performance ("I'll backtest this on BTC because BTC went up"), using indicator values that include the current bar's data for a signal on the current bar, or applying fundamental data (earnings, events) that was published after market hours.
Fix: Every signal must use only data from COMPLETED candles. Enter on the OPEN of the next candle after the signal, not the close of the signal candle.
Mistake #4: Survivorship Bias
Testing only on instruments that still exist today. If you backtest a strategy on the "top 20 crypto by market cap," you're only testing on coins that survived and thrived. The hundreds of coins that were in the top 20 in 2018 and subsequently crashed to zero are excluded. Your backtest results are biased upward because you're only testing on winners.
Fix: Include delisted instruments in your testing universe. If a coin was in the top 20 in 2019 but doesn't exist anymore, it should still be in your 2019 backtest.
Mistake #5: Not Enough Trades
A backtest showing 15 trades with an 80% win rate proves nothing. With 15 trades, the 95% confidence interval for the true win rate ranges from 52% to 96%. Your "80% win rate" strategy might actually have a 52% win rate — barely above random.
| Trades | Observed Win Rate | 95% Confidence Interval | Reliability |
|---|---|---|---|
| 15 | 80% | 52-96% | Very low |
| 50 | 60% | 46-73% | Low |
| 100 | 55% | 45-65% | Moderate |
| 200 | 55% | 48-62% | Good |
| 500 | 55% | 51-59% | Strong |
Fix: Require minimum 100 trades for any conclusion. Use 200+ for strategies you'll trade with real money. Extend the backtest period or add instruments to generate more trades.
Mistake #6: Testing Only One Market Regime
A strategy backtested from January 2023 to December 2023 only encountered a bull market. It might have a 70% win rate and 3.0 profit factor — spectacular results that mean nothing because the strategy was never tested in a bear market or sideways chop.
Fix: Your backtest period MUST include at least one complete cycle: bull market, bear market, and consolidation. For crypto, this means at least 3-4 years of data (2020-2024 covers COVID crash, bull run, crypto winter, and recovery).
Mistake #7: Cherry-Picking Start/End Dates
Starting your backtest on January 2023 (bottom of crypto winter) and ending December 2024 (peak of next cycle) makes almost any long strategy look profitable. Shifting the start date to November 2021 and ending March 2023 would show the same strategy in catastrophic drawdown.
Fix: Use the longest data period available. Don't adjust dates to improve results. If your strategy's performance is highly sensitive to start/end dates, it's not robust.
Mistake #8: Ignoring Maximum Drawdown
A strategy with 200% total return and 60% maximum drawdown is psychologically untradeable. Nobody holds through watching their account drop from $100,000 to $40,000, regardless of what the backtest says. Yet traders regularly show return numbers without drawdown context.
Fix: Maximum drawdown is as important as total return. Calculate the return-to-drawdown ratio (Calmar ratio). A ratio below 1.0 means the strategy's drawdown exceeds its annualized return — proceed with extreme caution. Aim for 2.0+ Calmar for comfortable live trading.
Mistake #9: Not Using Out-of-Sample Testing
You develop a strategy on 2020-2023 data, optimize it until it's profitable, and declare success. But you've never tested it on data it hasn't seen. This is like a student who studies the answer key and claims they understand the material.
Fix: Split your data. Use 60-70% for development (in-sample) and hold back 30-40% for validation (out-of-sample). Only trust results that hold on both datasets. If the strategy works on in-sample but fails on out-of-sample, it's overfitted.
Mistake #10: Confusing Correlation with Causation
Your backtest shows that buying on Tuesdays produces higher returns than other days. Is this a real edge or a coincidence? Probably coincidence. Unless there's a logical reason (institutional flows, options expiry schedules), day-of-week effects are almost certainly data-mined artifacts.
The same applies to any pattern without a logical mechanism. If a strategy works but you can't explain WHY it works beyond "the data showed it," be extremely suspicious. Real edges have economic or behavioral reasons: trend following works because of herding behavior, mean reversion works because of liquidity provision mechanics, etc.
Fix: For every profitable pattern, ask "why does this work?" If you can't articulate a market mechanism, the pattern is likely noise.
Build a Proper Backtest
StratBase.ai handles many of these pitfalls automatically: costs are included by default, signals execute on the next candle open (no look-ahead), and results include maximum drawdown alongside returns. But understanding these mistakes matters even with good tools — because the decisions about what to test and how to interpret results remain yours.
Backtest right the first time.
StratBase.ai eliminates look-ahead bias, includes trading costs automatically, and shows complete risk metrics — so you can focus on strategy logic instead of methodology errors.
Further Reading
About the Author
Quantitative researcher with 8+ years in algorithmic trading and strategy backtesting. Specializes in technical indicator analysis and risk-adjusted performance metrics.
FAQ
What is the biggest backtesting mistake?▾
Overfitting — optimizing parameters until the backtest looks perfect on historical data. An overfitted strategy captures noise, not signal. It produces 90%+ win rates on past data and fails immediately in live trading. The fix: use in-sample data for development and out-of-sample data for validation. If the strategy doesn't work on data it wasn't optimized for, it's overfitted.
How do you avoid look-ahead bias in backtesting?▾
Look-ahead bias occurs when your backtest uses information that wouldn't have been available at the time of the trade. Common examples: using today's close for a decision made during the day, calculating indicators that include future data points, or selecting instruments based on current knowledge (e.g., only testing on coins that survived). The fix: ensure every calculation uses only data available BEFORE the decision point.
How many trades does a backtest need to be reliable?▾
Minimum 100 trades for basic statistical significance, 200+ for reliable confidence intervals, and 500+ for robust strategy validation. A backtest with 30 trades, even with a 70% win rate, could easily be random luck — the confidence interval is too wide. More trades across more market conditions (bull, bear, sideways) produce more reliable results.
Comments (0)
Loading comments...