Donchian Channel Breakout Strategy: The Turtle Traders' Secret
In 1983, commodity trader Richard Dennis made a bet with his partner William Eckhardt: could trading be taught, or was it an innate talent? Dennis recruited 23 novices, taught them a specific rule-based system, and gave them real money to trade. The "Turtle Traders" collectively earned over $175 million in the next four years. At the core of their system was the Donchian Channel — arguably the simplest technical indicator ever devised. One channel. One rule. Enormous profits.
The Donchian Channel
Richard Donchian, the "father of trend following," introduced this concept in the 1950s. The channel has three lines:
- Upper Band: Highest high of the last N periods
- Lower Band: Lowest low of the last N periods
- Middle Line: Average of upper and lower bands
That's it. No exponential smoothing, no ATR multipliers, no weights. If the highest price in the last 20 days was $65,000, the upper band is $65,000. If the lowest was $58,000, the lower band is $58,000. The middle line is $61,500.
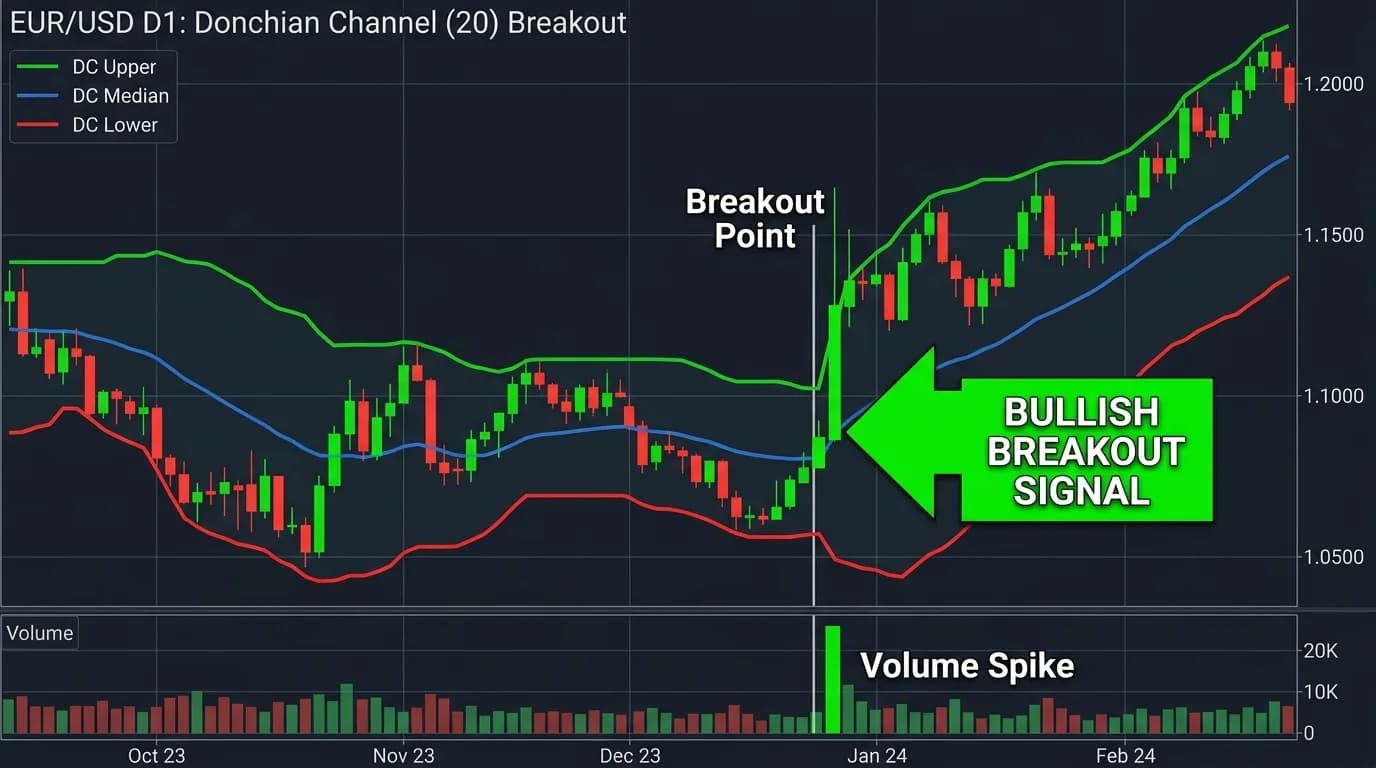
The signal is equally simple: when price breaks above the upper band, it's making a new N-period high — a breakout. When it breaks below the lower band, it's making a new N-period low — a breakdown.
The Original Turtle Rules
The Turtles used two complementary systems:
System 1: Short-Term (20/10)
- Entry: Buy when price exceeds the 20-day high; sell short when price falls below the 20-day low
- Exit: Close longs when price falls below the 10-day low; close shorts when price rises above the 10-day high
- Filter: Skip the entry if the previous 20-day breakout was a winner (the idea being that trends in the same direction are less likely to continue immediately)
System 2: Long-Term (55/20)
- Entry: Buy when price exceeds the 55-day high; sell short when price falls below the 55-day low
- Exit: Close longs when price falls below the 20-day low; close shorts when price rises above the 20-day high
- No filter: Every breakout is taken
Position Sizing
The Turtles used ATR-based sizing: one "unit" equaled 1% of account equity divided by (ATR × dollar per point). Maximum four units per market, maximum 12 units in correlated markets. This position sizing was as important as the entry rules — it ensured consistent risk per trade regardless of market volatility.
Does It Still Work? Modern Backtest Results
Markets have changed since the 1980s. More participants, faster execution, algorithmic competition. We tested both Turtle systems on modern data:
Traditional Markets (EUR/USD Daily, 2019-2024)
| System | Trades | Win Rate | PF | Max DD |
|---|---|---|---|---|
| System 1 (20/10) | 82 | 33% | 1.06 | 24% |
| System 2 (55/20) | 31 | 39% | 1.18 | 19% |
On EUR/USD, the results are marginal. System 1 is barely profitable after fees. System 2 shows a small edge. The forex market has become highly efficient for simple channel breakouts.
Crypto Markets (BTC/USDT Daily, 2020-2024)
| System | Trades | Win Rate | PF | Max DD |
|---|---|---|---|---|
| System 1 (20/10) | 56 | 38% | 1.34 | 28% |
| System 2 (55/20) | 18 | 44% | 1.72 | 22% |
On BTC, the results are considerably better — especially System 2. Crypto markets in 2020-2024 exhibited the kind of persistent trends that the system was designed to capture. The 55-day breakout on BTC caught the 2020-2021 bull run, the 2022 bear trend, and the 2023-2024 recovery.
Why Crypto Revives the Turtle System
The Turtle system thrives in markets with strong, persistent trends and high volatility — exactly what crypto provides. Traditional markets have seen trend persistence decline as more participants exploit trend-following signals. Crypto is still comparatively inefficient:
- Retail-dominated order flow creates sustained momentum
- Liquidation cascades amplify trends beyond "fair value"
- 24/7 trading means no overnight gaps to disrupt trends
- Lower institutional arbitrage compared to forex or equities
Adapting for Modern Trading
The original rules can be improved with modern filters:
- ADX filter: Only take breakouts when ADX > 20. This improved System 1 on BTC from 1.34 to 1.52 profit factor by avoiding choppy periods.
- Volume confirmation: Require breakout bar volume to be above average. Improved System 1 to 1.47 PF.
- Multi-timeframe: Only trade daily breakouts in the direction of the weekly channel. System 1 improved to 1.61 PF.
Donchian as a Building Block
Beyond the full Turtle system, the Donchian Channel serves as a useful component in other strategies. The 20-period middle line (average of highest high and lowest low) acts as a trend filter — similar to a moving average but based on extremes rather than closes. Some traders prefer this because it captures the true range of price behavior rather than just closing prices.
The channel width (upper minus lower) also serves as a volatility measure. Narrow channels indicate consolidation; widening channels indicate trend development. This is conceptually similar to Bollinger Bandwidth but uses a different mathematical basis.
Recreate the Turtle Trading system
StratBase.ai supports Donchian Channels with configurable periods. Test the 20/10 and 55/20 systems on crypto, forex, or stocks. Build your Turtle strategy →
What is a Donchian Channel?
The simplest channel indicator: upper band = N-period highest high, lower band = N-period lowest low, middle = their average. Default N=20. A break above the upper band signals a bullish breakout.
What is the Turtle Trading strategy?
Two Donchian systems: System 1 (20-day entry, 10-day exit) and System 2 (55-day entry, 20-day exit), with ATR-based position sizing. Taught by Richard Dennis to 23 novices who collectively earned $175M+.
Does the Donchian breakout still work?
Marginal on forex (1.06-1.18 PF). Much better on crypto (1.34-1.72 PF), which exhibits the persistent trends the system needs. System 2 (55-day) outperforms on modern data.
Further Reading
About the Author
Financial data analyst focused on crypto derivatives and on-chain metrics. Expert in futures market microstructure and funding rate strategies.
FAQ
What is a Donchian Channel?▾
A Donchian Channel plots the highest high and lowest low over the last N periods. The upper band is the N-period highest high, the lower band is the N-period lowest low, and the middle is their average. Default period is 20. It's the simplest possible channel — no moving averages or volatility adjustments.
What is the Turtle Trading strategy?▾
The Turtle Traders used two Donchian Channel systems: System 1 (20-day breakout entry, 10-day breakout exit) for shorter-term trades and System 2 (55-day breakout entry, 20-day breakout exit) for longer-term trend following. Position sizing was based on ATR (N), risking 2% per unit. The system was famously taught by Richard Dennis to prove that trading could be taught.
Does the Donchian breakout still work?▾
The basic 20-day breakout has lower performance today than in the 1980s-90s due to increased market efficiency and algorithmic trading. However, on crypto markets — which behave more like commodities did decades ago — the strategy still shows positive expectancy, particularly on daily and weekly timeframes with the 55-day variant.
Related articles
Comments (0)
Loading comments...