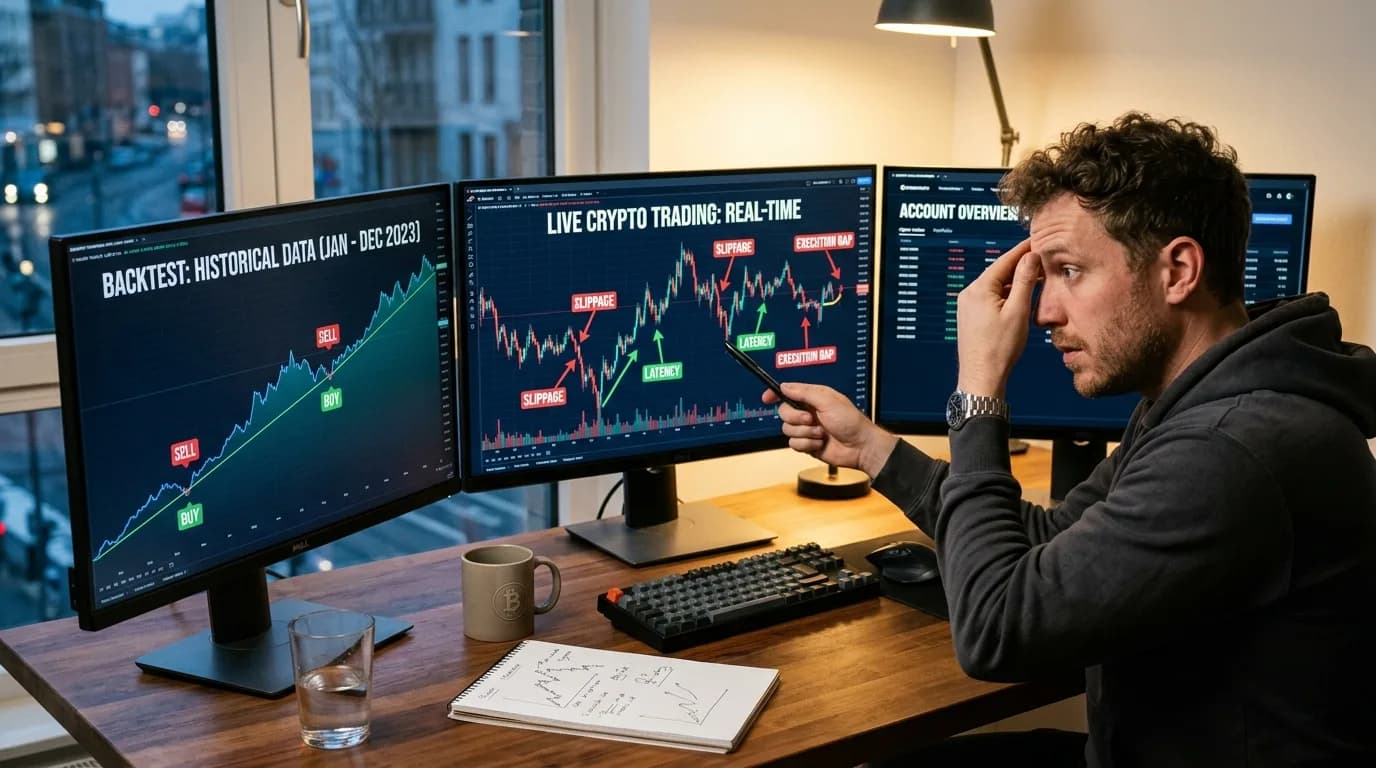
The Execution Gap: From Backtest to Live Trading
The gap between backtested performance and live trading results is the most frustrating reality in algorithmic trading. Strategies that showed 120% annual returns in simulation often deliver 30–50% in practice — or worse, lose money. Understanding why this gap exists and how to minimize it is essential for every serious trader.
Anatomy of the Execution Gap
The execution gap refers to the systematic difference between theoretical backtest returns and actual live trading performance. Research across traditional and crypto markets consistently shows that live returns average 40–70% lower than backtested returns. This isn’t bad luck — it’s structural, stemming from assumptions that backtests make but reality does not honor.
The gap has multiple components, each of which contributes a measurable drag on performance. Together, they can transform a seemingly exceptional strategy into a mediocre or losing one.
The Seven Sources of Execution Gap
| Source | Backtest Assumption | Live Reality | Typical Impact |
|---|---|---|---|
| Fill price | Executes at candle close/open | Slippage of 0.02–0.50% | −5 to −15% annually |
| Latency | Instant execution | 50–500ms delay | −2 to −8% annually |
| Liquidity | Unlimited depth | Orders move the market | −3 to −20% annually |
| Partial fills | Full execution guaranteed | Often partial, especially limit orders | −5 to −15% annually |
| Exchange outages | Always available | Downtime during volatility | −1 to −10% per event |
| Data differences | Clean OHLCV data | Wicks, gaps, stale quotes | −2 to −5% annually |
| Psychological factors | Perfect discipline | Hesitation, override, panic | −10 to −30% annually |
Slippage: The Biggest Hidden Cost
Slippage is the difference between the price your backtest assumed and the price you actually get. In a backtest, a market buy order executes at the candle’s close price. In reality, the order walks up the order book, consuming liquidity at progressively worse prices.
The magnitude of slippage depends on three factors:
- Order size relative to book depth. A $1,000 order on BTC/USDT might get 0.01% slippage. A $100,000 order might get 0.10–0.30%. A $1,000,000 order might get 0.50–1.00%.
- Market volatility. During high-volatility periods, order book depth thins dramatically. Slippage that was 0.05% during calm markets can become 0.50% during a crash.
- Time of day. Asian trading hours often have thinner books for USD-quoted pairs. Weekend liquidity is typically 30–50% lower than weekday liquidity.
A simple thought experiment: if your strategy’s average profit per trade is 0.8%, and slippage costs 0.15% per trade, slippage alone consumes 19% of every winning trade. At 500 trades per year, that’s the difference between a 90% annual return and a 55% annual return.
The Psychology Gap
Perhaps the most underestimated source of execution gap is the trader themselves. Backtests assume robotic discipline — every signal is executed, every stop is honored, no trades are skipped or overridden. In practice:
- Hesitation on entries. After a losing streak, traders delay entries or skip signals, missing the recovery trades that restore the equity curve.
- Premature exits. A position shows 3% profit, and the trader exits early «to lock in gains» instead of holding for the 8% target the system specifies.
- Moving stop-losses. During a drawdown, the trader widens stops «just this once,» transforming a −2% planned loss into a −7% realized loss.
- Revenge trading. After a loss, the trader doubles position size on the next trade to «make it back,» violating risk management rules.
- System abandonment. After a 15% drawdown (which is perfectly normal for most strategies), the trader stops following the system entirely, right before the recovery.
Closing the Gap: Practical Steps
While the execution gap can never be eliminated entirely, it can be dramatically reduced with deliberate practices:
- Add slippage buffers to backtests. Configure 0.05–0.15% slippage per trade in your backtest settings. If the strategy still works, it has a genuine edge.
- Use conservative fill assumptions. Assume entry at the next candle’s open (not current candle’s close) and exit with one candle delay. This models real-world latency.
- Paper trade before going live. Run the strategy on a demo account for 2–4 weeks. Compare paper results against what the backtest predicted for the same period.
- Start with minimal capital. Deploy 10–20% of intended capital initially. Scale up only after 3+ months of consistent live results matching backtest expectations.
- Automate execution. If possible, use API-connected bots to eliminate psychological interference. Every manual step is an opportunity for emotional deviation.
- Track deviation metrics. Log every trade where you deviated from the system (skipped signal, early exit, moved stop). Quantify the cost of these deviations to build discipline.
Measuring the Gap on StratBase.ai
StratBase.ai helps traders anticipate the execution gap through several mechanisms. The platform allows configuring realistic commission rates, and the AI analysis flags strategies with characteristics that predict large execution gaps: high trade frequency, dependence on precise entry timing, or thin-margin trades where small cost changes flip profitability.
The immutable backtest record also serves as an honest benchmark. When traders eventually deploy live, they can compare actual results against their StratBase.ai backtest to quantify their personal execution gap and identify which sources contribute most to the difference.
Key Takeaways
- Live trading returns average 40–70% below backtested returns across all asset classes
- Slippage, latency, and partial fills are structural costs that no strategy can avoid
- Psychological factors (hesitation, early exits, stop manipulation) often cause more damage than technical factors
- Adding 0.10–0.15% slippage per trade to backtests provides a much more realistic performance estimate
- Paper trading and gradual capital deployment are essential steps before full-scale live trading
Further Reading
About the Author
Trading systems developer and financial engineer. 10+ years building automated trading infrastructure and backtesting frameworks across crypto and traditional markets.
FAQ
Why do live results differ from backtests?▾
Multiple factors: 1) Slippage — backtest assumes perfect fills, reality doesn't. 2) Latency — signal appears, you need seconds to react. 3) Market impact — your order moves the price (especially in low liquidity). 4) Psychology — you hesitate, skip signals, move stops. 5) Regime change — market conditions during live trading differ from backtest period. 6) Look-ahead bias — subtle data leaks in backtest code.
How to reduce the execution gap?▾
1) Add 0.05-0.1% slippage to backtests. 2) Paper trade for 1-3 months before going live. 3) Start with minimum position sizes. 4) Automate execution to remove psychology. 5) Use limit orders instead of market orders. 6) Backtest on out-of-sample data (not the same data you optimized on).
Further reading
Related articles
Comments (0)
Loading comments...