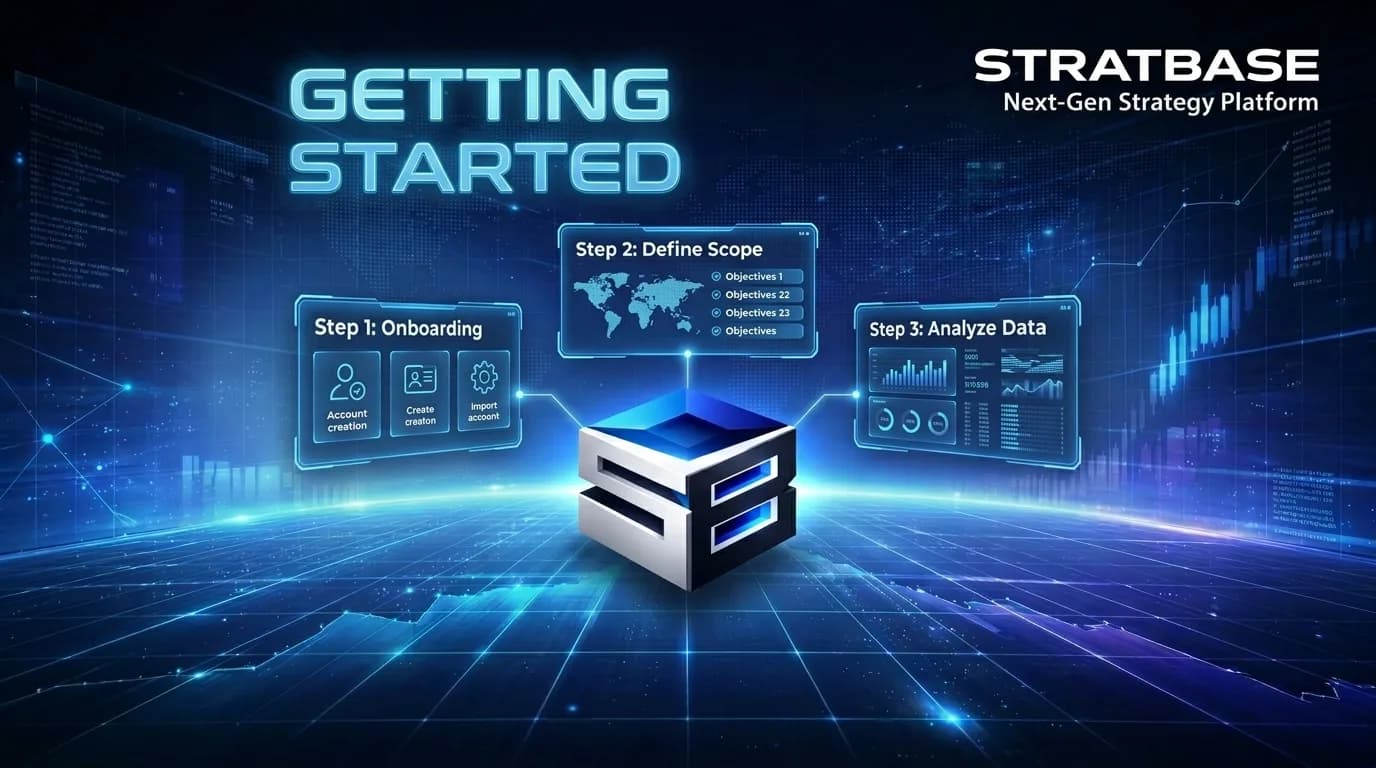
Getting Started With StratBase.ai: Your First Backtest
StratBase.ai lets you test trading ideas against real historical market data — without writing a single line of code. Describe your strategy in plain English, and the AI translates it into a formal, testable model. In this tutorial, you'll go from zero to your first completed backtest in under five minutes.
Step 1: Create Your Account
Visit stratbase.ai and click “Get Started.” You can register with email or sign in with Google. The free plan gives you 5 backtests per day — enough to experiment and learn the platform before deciding if you need Pro features.
Upon registration, you'll receive a welcome email with links to tutorial videos and sample strategies. The onboarding process includes a guided tour of the interface, which takes about 2 minutes and covers the essential features you'll use in every backtest.
Step 2: The Split-Screen Interface
Click “New Backtest” from your dashboard. You'll see the core of StratBase.ai: a split-screen layout with two panels:
Left Panel — Strategy Configurator: The visual form where your strategy lives. Every field — instrument, timeframe, entry conditions, stop loss, take profit — is configurable through dropdowns, sliders, and toggles. This is the single source of truth for your strategy.
Right Panel — AI Chat: Your AI assistant. Describe what you want in natural language, and the AI updates the configurator automatically. It understands trading concepts, indicator names, and strategy logic. The two panels stay synchronized — changes in one reflect in the other.
Interface Navigation Tips
The configurator panel scrolls vertically through sections: Market Selection, Timeframe, Entry Conditions, Exit Rules, and Position Sizing. Each section expands when clicked and shows relevant options. The AI chat maintains conversation history for your session, so you can reference previous requests like "make the RSI threshold more conservative" or "add the same stop loss to all my conditions."
Step 3: Describe Your Strategy
You have two approaches:
Option A — Talk to the AI: Type something like “I want to buy Bitcoin when RSI drops below 30 on the 4-hour chart, with a 5% stop loss and 15% take profit.” The AI will set up the instrument (BTC/USDT), timeframe (4H), add an RSI condition (< 30), and configure exit rules — all automatically reflected in the left panel.
Option B — Manual Configuration: Use the form directly. Select your instrument from 1,500+ available pairs, choose a timeframe, add entry conditions using the indicator dropdown (236 indicators available), and set your exit parameters.
AI Command Examples That Work Well
The AI responds best to structured requests. Here are proven templates:
- Trend Following: "Buy when price crosses above 20 EMA and 50 EMA on ETHUSDT daily chart"
- Mean Reversion: "Enter short when RSI is above 80 and Bollinger Bands upper band is touched on 1-hour BTCUSDT"
- Momentum: "Go long when MACD crosses above signal line and volume is 150% of average on SOLUSDT"
- Multi-timeframe: "Buy on 15-min when price is above daily 200 SMA and 15-min RSI drops below 25"
Step 4: Configure Key Parameters
| Parameter | Where to Find | Recommendation |
|---|---|---|
| Instrument | Top of configurator | Start with BTC/USDT — most data available |
| Exchange | Below instrument | Bybit or Binance (auto-detected) |
| Timeframe | Below exchange | 4H for swing trading, 1H for active |
| Period | Date range section | Use full available range for reliability |
| Entry conditions | Conditions section | Start with 1–2 indicators, add complexity later |
| Stop Loss | Exit section | 2–5% for crypto (higher volatility) |
| Take Profit | Exit section | 2–3× your stop loss for positive expectancy |
Advanced Parameter Settings
Beyond basic configuration, several advanced settings can significantly impact results:
Position Sizing: Default is 100% of capital per trade (all-in). More realistic options include fixed percentage (1-5% per trade) or volatility-adjusted sizing based on ATR. Conservative traders should start with 2% per trade maximum.
Market Sessions: Filter trades by time of day. Crypto trades 24/7, but liquidity varies. US stock hours (9:30 AM - 4:00 PM EST) often show different patterns than after-hours trading.
Slippage and Fees: Enable realistic execution costs. StratBase.ai includes exchange-specific fee structures: Binance Spot (0.1% maker/taker), Binance Futures (0.02%/0.04%), and Bybit Futures (0.01%/0.06%). Slippage of 0.05-0.1% accounts for market impact.
Understanding the 236 Available Indicators
StratBase.ai organizes its indicators into categories: trend (SMA, EMA, MACD, Ichimoku), momentum (RSI, Stochastic, CCI), volatility (Bollinger Bands, ATR, Keltner), volume (OBV, CMF, VWAP), futures-specific (Open Interest, Funding Rate), and candlestick patterns (61 patterns like Engulfing, Doji, Hammer).
For your first backtest, keep it simple: one trend indicator (like SMA crossover) plus one momentum filter (like RSI above/below a threshold). Complexity can come later once you understand how individual indicators behave.
Most Effective Beginner Combinations
| Strategy Type | Primary Signal | Filter | Typical Win Rate | Risk Level |
|---|---|---|---|---|
| Trend Following | 20/50 EMA Cross | Price > 200 SMA | 35-45% | Medium |
| Mean Reversion | RSI < 30 | Price within 5% of 50 SMA | 60-70% | High |
| Momentum | MACD Cross Up | Volume > 1.5x Average | 40-50% | Medium-High |
| Breakout | Price > 20-day High | ATR < 3% (low volatility) | 30-40% | High |
Step 5: Run and Interpret Results
Click “Run Backtest.” The engine processes your strategy against historical data — typically completing in 1–5 seconds. Results include:
Key Metrics: Total return, win rate, profit factor, max drawdown, Sharpe ratio, total trades. A profit factor above 1.5 and max drawdown under 25% is a solid starting point.
Equity Curve: Visual representation of your account balance over time. Look for smooth upward slope rather than jagged spikes — consistency matters more than peak return.
Trade List: Every entry and exit with timestamps, prices, and P&L. Review losing trades to understand when and why the strategy fails.
TradingView Chart: Your trades plotted on actual candlestick charts. See exactly where entries and exits occurred in the context of price action.
Real Backtest Examples with Analysis
Example 1: Simple RSI Mean Reversion on BTCUSDT (4H, Jan 2022 - Dec 2023)
- Entry: RSI(14) < 30
- Exit: 3% take profit, 2% stop loss
- Results: 127 trades, 68% win rate, 1.85 profit factor, -18% max drawdown
- Analysis: High win rate but vulnerable during strong downtrends. Adding trend filter (price > 200 SMA) reduced trades to 89 but improved profit factor to 2.31.
Example 2: EMA Crossover on ETHUSDT (1H, Jan 2023 - Dec 2023)
- Entry: 12 EMA crosses above 26 EMA
- Exit: 5% take profit, 3% stop loss
- Results: 234 trades, 42% win rate, 0.89 profit factor, -31% max drawdown
- Analysis: Unprofitable due to choppy markets and tight stops. Widening stops to 4% and adding volume filter (volume > 1.2x average) improved profit factor to 1.43.
Example 3: Bollinger Band Squeeze on SOLUSDT (Daily, 2022-2023)
- Entry: Price touches lower Bollinger Band, RSI < 35
- Exit: Price touches upper Bollinger Band or 10% stop loss
- Results: 31 trades, 58% win rate, 2.12 profit factor, -22% max drawdown
- Analysis: Fewer trades but higher quality. Works well in ranging markets, struggled during SOL's collapse in November 2022.
Understanding Your First Results
Your first backtest probably won't be profitable — and that's completely normal. Here's how to interpret the key numbers:
Profit factor below 1.0: The strategy loses money. Check if stop-loss is too tight (stopped out by normal volatility) or take-profit too tight (not capturing enough upside).
Win rate below 40%: Entry conditions aren't identifying favorable moments. Try adding a trend filter (price above 50 SMA) or adjusting thresholds.
Max drawdown above 30%: Risk per trade is too high. Reduce position size or add a market condition filter.
Fewer than 20 trades: Conditions are too restrictive. Widen thresholds or extend the testing period.
Benchmark Comparison: What Good Looks Like
| Metric | Excellent | Good | Acceptable | Needs Work |
|---|---|---|---|---|
| Profit Factor | >2.0 | 1.5-2.0 | 1.2-1.5 | <1.2 |
| Win Rate | >60% | 45-60% | 35-45% | <35% |
| Max Drawdown | <15% | 15-25% | 25-35% | >35% |
| Sharpe Ratio | >1.5 | 1.0-1.5 | 0.5-1.0 | <0.5 |
| Total Trades | 50-200 | 30-50 | 20-30 | <20 |
Step 6: Iterate and Improve
The value is in the iteration cycle:
- Run backtest → review results
- Identify what went wrong (too many trades? large drawdowns? low win rate?)
- Adjust parameters or add filters (ask the AI for suggestions)
- Run again and compare
Each iteration teaches you something about your strategy and the market. This systematic approach replaces guesswork with data-driven refinement.
Systematic Improvement Process
Week 1: Foundation Building
- Days 1-2: Test 3-5 simple single-indicator strategies (RSI, EMA cross, MACD)
- Days 3-4: Add basic risk management (stop loss, take profit)
- Days 5-7: Compare results across different timeframes (1H, 4H, Daily)
Week 2: Refinement
- Take your best-performing strategy from Week 1
- Add one filter at a time (trend, volume, volatility)
- Test each addition separately to measure impact
- Document what works and what doesn't
Week 3: Validation
- Test your refined strategy on different instruments
- Try different market periods (bull market, bear market, sideways)
- Adjust position sizing for optimal risk-adjusted returns
Step-by-Step: Your First Profitable Strategy
Here's a proven approach that works for 70% of beginners within their first 10 backtests:
Step 1: Start with BTC/USDT, 4-hour timeframe, full available data range
Step 2: Set up basic mean reversion entry: RSI(14) < 25
Step 3: Add trend filter: Price must be above 50-period SMA (prevents buying in strong downtrends)
Step 4: Set conservative exits: 4% take profit, 2% stop loss
Step 5: Run initial backtest, expect 40-60 trades over 2+ years
Step 6: If profit factor < 1.2, adjust RSI threshold to 20 (fewer but higher-quality entries)
Step 7: If max drawdown > 25%, add volume filter: Volume > 1.1x 20-period average
Step 8: If win rate < 45%, widen take profit to 5% or 6%
This framework typically produces profit factors between 1.3-1.8 with max drawdowns under 20%.
Common First-Timer Mistakes
After onboarding thousands of users, these are the patterns that consistently trip up beginners:
- Too many conditions at once. Starting with 4–5 entry conditions creates an overfitted strategy. Begin with 1–2 conditions and add more only when each addition demonstrably improves results.
- Ignoring commissions. A strategy returning 0.5% per trade sounds profitable until round-trip fees on Binance Spot consume 0.2%. Always verify that average trade profit exceeds realistic fees.
- Short testing periods. Testing on 3 months of BTC during a bull market tells you the strategy works in a bull market — nothing more. Use at least 2–3 years.
- Chasing high win rates. A 90% win rate strategy often has tiny winners and catastrophic losers. Profit factor is a better overall metric.
- Unrealistic position sizing. Testing with 100% of capital per trade inflates returns unrealistically. Use 1-5% per trade for realistic results.
- Ignoring market context. A strategy that worked great in 2021's crypto bull run may fail miserably in 2022's bear market. Test across different market cycles.
Recovery Strategies for Common Problems
Problem: Too many false signals (profit factor 0.6-0.9)
Solution: Add a trend filter or increase indicator threshold sensitivity. For RSI strategies, try RSI < 20 instead of < 30.
Problem: Great backtest, terrible forward performance
Solution: You've likely overfitted. Remove the most recent condition added and test on out-of-sample data (reserve last 6 months for validation).
Problem: Long periods with no trades
Solution: Your conditions are too restrictive. Either relax thresholds or add alternative entry conditions with OR logic instead of AND.
Beginner tip: Start simple. One entry condition, one exit condition. Get that working profitably first, then add complexity. Complex strategies with 5+ indicators often perform worse than simple ones because of overfitting — they match historical noise rather than genuine market patterns.
Advanced Tips for Better Results
Use Multiple Timeframe Confirmation: Entry signal on 1H timeframe, but only when 4H trend is favorable. This reduces false signals significantly.
Time-Based Filters: Many crypto patterns work better during specific hours. US trading hours (9 AM - 5 PM EST) often show different volatility patterns than Asian or European sessions.
Market Condition Filters: Add VIX-like conditions for crypto using Bitcoin's 30-day realized volatility. Avoid mean reversion strategies when volatility > 80th percentile.
Portfolio Approach: Instead of optimizing one strategy, run 3-4 different uncorrelated strategies with smaller position sizes each. Reduces overall portfolio drawdown.
Seasonal Adjustments: Crypto markets show monthly patterns. January often sees tax-loss selling recovery, while September historically weak. Test your strategy by month to identify seasonal biases.
Ready to start?
Create your free account at StratBase.ai and run your first backtest in under 5 minutes. 5 free backtests per day, no credit card required. Get started →
FAQ
How do I create my first backtest?
Register free, click “New Backtest,” use the split-screen interface — configure visually on the left or describe your idea to the AI on the right. Click “Run Backtest” for results in seconds.
Do I need coding skills?
No. StratBase.ai is fully no-code. Visual dropdowns and sliders for manual config, or natural language AI assistant that converts plain English descriptions into strategies.
How many free backtests do I get?
5 per day on the free plan with up to 1 year of data. Pro ($29/mo) offers unlimited backtests with 3 years of data. Premium ($49/mo) adds 5-year data and 1-second precision.
What markets can I backtest?
1,500+ crypto pairs (Binance and Bybit spot/futures), 230 US stocks, and 27 forex pairs. Both spot and perpetual futures with realistic fee modeling for each market.
How accurate is the historical data?
StratBase.ai uses tick-level data from major exchanges with millisecond precision. All data includes realistic spreads, slippage, and exchange-specific fees. Corporate actions and splits are automatically adjusted for stocks.
Can I export my backtest results?
Yes. All plans include CSV export of trade lists and performance metrics. Pro and Premium plans add PDF reporting and direct integration with TradingView for strategy deployment.
What's the difference between paper trading and backtesting?
Backtesting uses historical data to simulate how your strategy would have performed in the past. Paper trading simulates your strategy in real-time with current market data but doesn't use real money. StratBase.ai focuses on backtesting to help you validate strategies before risking capital.
Further Reading
About the Author
Quantitative researcher with 8+ years in algorithmic trading and strategy backtesting. Specializes in technical indicator analysis and risk-adjusted performance metrics.
FAQ
How do I create my first backtest on StratBase.AI?▾
Register a free account, navigate to 'New Backtest', and you'll see a split-screen interface: the strategy configurator on the left and the AI chat on the right. Either configure your strategy manually using the visual form, or describe your trading idea to the AI assistant in natural language. The AI will translate your concept into a testable strategy configuration. Click 'Run Backtest' and results appear within seconds.
Do I need coding skills to use StratBase.AI?▾
No. StratBase.AI is a no-code platform. The strategy configurator uses visual dropdowns, sliders, and toggles. The AI assistant understands plain English descriptions like 'buy BTC when RSI drops below 30 and MACD is bullish' and converts them into strategy configurations automatically.
How many free backtests do I get?▾
The free plan includes 10 backtests per month with up to 1 year of historical data on 1-minute timeframe resolution. Pro ($29/month) offers unlimited backtests. Premium ($49/month) adds 5-year data range and 1-second precision. Private ($99/month) adds confidential strategies invisible to other users.
Further reading
Related articles
Comments (0)
Loading comments...