Multi-Timeframe Backtesting: How to Use Multiple Chart Periods
The most common feedback I give traders who submit strategies for review: "You're trying to catch a trend on the 15-minute chart without checking the 4-hour chart first." Single-timeframe strategies are inherently limited — they see one slice of market context. Multi-timeframe analysis solves this by combining the strategic view (higher timeframe) with the tactical view (lower timeframe).
The Logic Behind Multi-Timeframe Analysis
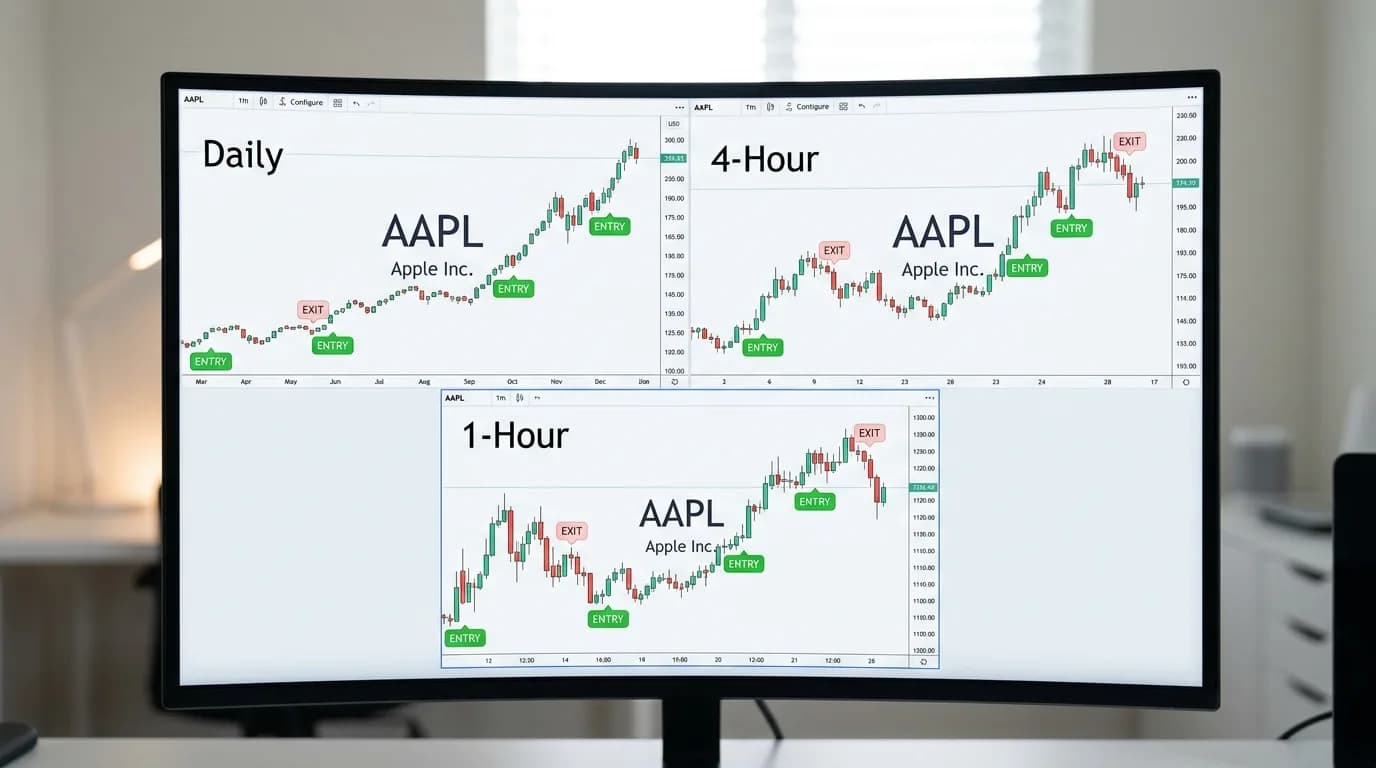
Markets are fractal — patterns repeat at different scales. A trend on the daily chart contains pullbacks visible on the 4-hour chart, which contain micro-trends visible on the 1-hour chart. Multi-timeframe analysis leverages this structure:
- Higher timeframe (HTF): Determines the overall direction — the "strategic context." Are we in an uptrend, downtrend, or range?
- Lower timeframe (LTF): Provides the entry trigger — the "tactical execution." Where exactly do we enter within the HTF context?
The simplest example: only take long entries on the 1-hour chart when the daily chart shows an uptrend (price above EMA 50). Only take short entries when the daily chart shows a downtrend. This single filter eliminates a massive number of losing trades caused by fighting the trend.
Timeframe Combinations
Not all timeframe combinations work equally well. The key is the ratio between them:
| HTF (Trend) | LTF (Entry) | Ratio | Best For |
|---|---|---|---|
| Weekly | Daily | 5x | Position trading, portfolio allocation |
| Daily | 4-hour | 6x | Swing trading |
| 4-hour | 1-hour | 4x | Active swing / intraday |
| 1-hour | 15-minute | 4x | Day trading |
| 15-minute | 5-minute | 3x | Aggressive day trading |
| 5-minute | 1-minute | 5x | Scalping |
The sweet spot is a 4-6x ratio. Below 3x, the timeframes are too similar and provide redundant information. Above 10x, the gap is too large — a daily trend direction doesn't provide useful context for a 1-minute entry because too much happens between the two scales.
How to Implement Multi-Timeframe in Backtesting
The implementation approach depends on your backtesting platform, but the logic is universal:
Method 1: Indicator on different timeframe. Calculate your trend indicator (e.g., EMA 50) on the higher timeframe and reference it from the lower timeframe. Most platforms support this directly. The key detail: the HTF indicator value must reflect the latest completed HTF candle, not the currently forming one. Using the current incomplete HTF candle introduces look-ahead bias.
Method 2: Condition filter. Add a condition like "4-hour EMA(50) > 4-hour EMA(200)" as a filter for your 1-hour strategy. The strategy only generates signals when this condition is true. In backtesting, ensure the condition is evaluated using only data available at the signal time — no future HTF data.
Method 3: Multiple strategy instances. Run a long-only strategy and a short-only strategy separately, then switch between them based on the HTF trend direction. This is more complex to implement but gives cleaner results because each direction can have independently optimized parameters.
Backtest Results: Single vs Multi-Timeframe
Here's what typically happens when you add a HTF trend filter to a LTF strategy:
| Metric | Single TF (1h only) | Multi TF (Daily + 1h) | Change |
|---|---|---|---|
| Total trades | 347 | 198 | -43% |
| Win rate | 44% | 52% | +8pp |
| Profit factor | 1.31 | 1.78 | +36% |
| Max drawdown | 22% | 14% | -36% |
| Net return | 38% | 41% | +8% |
| Sharpe ratio | 0.89 | 1.42 | +60% |
The pattern is consistent: fewer trades, higher quality, better risk-adjusted returns. The net return might be similar or slightly better, but the drawdown reduction and Sharpe improvement are where the real value lies. A strategy you can actually stick to during rough patches is worth more than a strategy with marginally higher returns that you'll abandon during a drawdown.
Common Multi-Timeframe Mistakes
Using too many timeframes. Two is optimal. Three is acceptable for experienced traders. Four or more creates conflicting signals and analysis paralysis. Each additional timeframe adds complexity without proportional benefit.
HTF timeframe too high for the strategy. A scalper doesn't need to check the weekly chart. The weekly trend direction has almost zero predictive power for a trade lasting 5 minutes. Match the HTF to your holding period — a 4-6x multiple of your LTF is the sweet spot.
Ignoring the HTF when it conflicts. The whole point of multi-timeframe analysis is discipline. If the daily chart says "bearish" and the 1-hour chart shows a tempting long setup, the multi-timeframe trader passes. Cherry-picking when to apply the filter defeats its purpose.
Multi-timeframe analysis is a natural extension of the backtesting fundamentals. Combine it with proper overfitting prevention to build strategies that are both filtered and robust.
"The bigger picture tells you WHAT to trade. The smaller picture tells you WHEN to trade. You need both." — Alexander Elder, Trading for a Living
Test multi-timeframe strategies effortlessly. StratBase.ai supports indicators calculated on different timeframes, letting you combine daily trend filters with hourly or minute-level entry signals in a single backtest.
FAQ
What is multi-timeframe backtesting?
Using two or more chart timeframes simultaneously: a higher timeframe for trend direction and a lower timeframe for entry signals. Trades only trigger when both timeframes align.
What timeframe combinations work best?
Use a 4-6x ratio: daily + 4-hour, 4-hour + 1-hour, 1-hour + 15-minute. Below 3x is redundant, above 10x creates conflicts.
Further Reading
About the Author
Financial data analyst focused on crypto derivatives and on-chain metrics. Expert in futures market microstructure and funding rate strategies.
FAQ
What is multi-timeframe backtesting?▾
Multi-timeframe backtesting uses data from two or more chart timeframes simultaneously. Typically, a higher timeframe (like daily or 4-hour) determines the trend direction, and a lower timeframe (like 1-hour or 15-minute) provides precise entry signals. The strategy only takes trades that align across both timeframes.
What timeframe combinations work best?▾
A general rule is to use a ratio of 4-6x between timeframes. Examples: daily + 4-hour (6x), 4-hour + 1-hour (4x), 1-hour + 15-minute (4x). Ratios above 10x (like daily + 5-minute) are too far apart and create signal conflicts.
Related articles
Comments (0)
Loading comments...