Walk-Forward Analysis: The Gold Standard of Strategy Validation
You optimized your strategy on 3 years of data and it shows 120% annual returns. You split the data 70/30 and the out-of-sample portion shows 40% returns. Is this strategy validated? No. You performed a single train/test split, which is better than nothing but still leaves massive room for overfitting. Walk-forward analysis is the method that professional quant firms actually trust.
I learned this the hard way. In 2019, I deployed a strategy that passed a standard in-sample/out-of-sample test with flying colors. It failed within six weeks of live trading. When I went back and ran a proper walk-forward analysis, the strategy showed negative expected value in 5 out of 8 windows. The single test split had gotten lucky.
How Walk-Forward Analysis Works
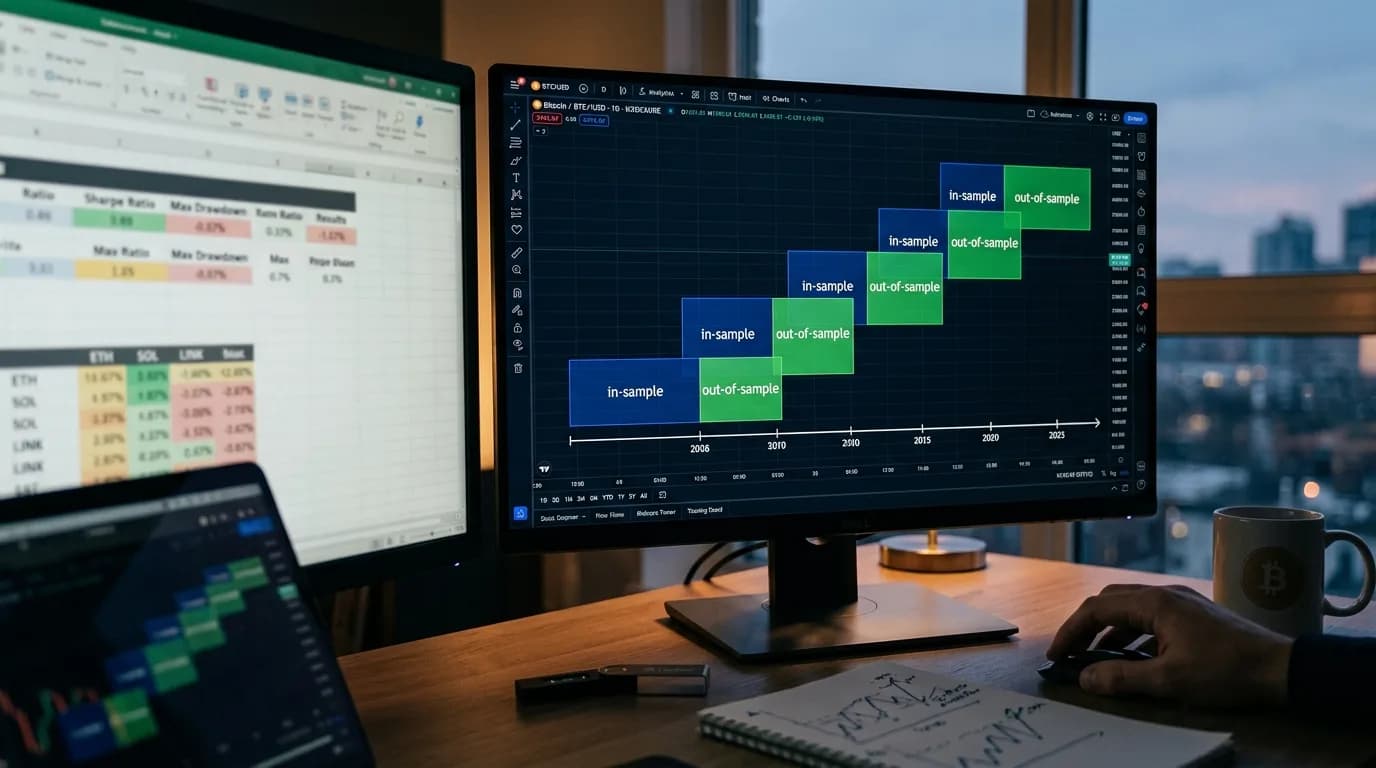
The core idea is simple: instead of one train/test split, you create many overlapping splits across your data. Each split optimizes the strategy on a historical window (in-sample) and tests it on the immediately following period (out-of-sample). You then stitch together all the out-of-sample results to get a realistic performance estimate.
Here's a concrete example with 5 years of data and 8 windows:
| Window | In-Sample (Optimize) | Out-of-Sample (Test) |
|---|---|---|
| 1 | Jan 2020 – Dec 2021 | Jan 2022 – Jun 2022 |
| 2 | Jul 2020 – Jun 2022 | Jul 2022 – Dec 2022 |
| 3 | Jan 2021 – Dec 2022 | Jan 2023 – Jun 2023 |
| 4 | Jul 2021 – Jun 2023 | Jul 2023 – Dec 2023 |
| 5 | Jan 2022 – Dec 2023 | Jan 2024 – Jun 2024 |
| 6 | Jul 2022 – Jun 2024 | Jul 2024 – Dec 2024 |
| 7 | Jan 2023 – Dec 2024 | Jan 2025 – Jun 2025 |
| 8 | Jul 2023 – Jun 2025 | Jul 2025 – Dec 2025 |
Each in-sample period is 2 years. Each out-of-sample period is 6 months. The windows overlap, advancing by 6 months each step. The strategy is re-optimized on each in-sample period, so the parameters can adapt to changing market conditions.
Why Walk-Forward Beats Simple Backtesting
A standard backtest optimizes on the full dataset, which means the parameters "know" the future. Even a train/test split has a problem: you're testing on one specific period, and that period might be unusually favorable or unfavorable.
Walk-forward analysis fixes both issues:
- No future information leakage. Each out-of-sample window is strictly after its in-sample window. The strategy can't peek ahead.
- Multiple test periods. Instead of one test, you get 6-8 independent tests across different market conditions. If the strategy works in most windows, it's robust. If it only works in 2 out of 8, it's fragile.
- Parameter stability check. You can see how the optimal parameters change across windows. If RSI period jumps from 8 to 22 to 11 to 30, the strategy is just fitting noise. If it stays between 12 and 16, there's a genuine underlying pattern.
The Walk-Forward Efficiency Ratio
The key output metric is the Walk-Forward Efficiency Ratio (WFE):
WFE = Out-of-Sample Annual Return / In-Sample Annual Return
A WFE of 0.5 means the strategy retains 50% of its in-sample performance when tested on fresh data. That's considered acceptable. A WFE above 0.6 is good. Below 0.3 is a red flag — the strategy is heavily overfitted.
| WFE Range | Interpretation | Action |
|---|---|---|
| > 0.7 | Excellent — strategy is robust | Proceed with caution, monitor live |
| 0.5 – 0.7 | Good — acceptable degradation | Proceed, but use conservative sizing |
| 0.3 – 0.5 | Mediocre — significant overfitting | Simplify the strategy, reduce parameters |
| < 0.3 | Poor — strategy is overfitted | Reject or fundamentally redesign |
Step-by-Step Implementation
- Choose your window sizes. In-sample should be 2-5x longer than out-of-sample. For daily trading strategies on crypto, I typically use 18-month in-sample and 6-month out-of-sample. For higher-frequency strategies, you can shorten both.
- Decide the step size. This is how much the window advances each iteration. Smaller steps mean more windows but also more overlap between in-sample periods. Step size equal to the out-of-sample length gives non-overlapping test periods — the cleanest setup.
- Run optimization on each in-sample window. Use the same optimization criteria you'd use normally — maximize Sharpe ratio, profit factor, or whatever your objective function is.
- Record the optimal parameters. Track how they change across windows. Stable parameters indicate a robust strategy. Wildly varying parameters indicate noise-fitting.
- Test each window's optimal parameters on the corresponding out-of-sample period. Record the results — return, drawdown, Sharpe, number of trades.
- Stitch together all out-of-sample results. This creates a synthetic equity curve that represents how the strategy would have performed with periodic re-optimization — much closer to real-world deployment.
- Calculate the WFE. Compare stitched out-of-sample performance to average in-sample performance.
Common Walk-Forward Mistakes
Too few windows. Three walk-forward windows isn't enough. One outlier window can dominate the results. Use at least 6, preferably 10+.
In-sample too short. If your in-sample window doesn't contain enough trades for meaningful optimization, the parameters will be unreliable. Each in-sample period needs at minimum 100 trades, ideally 200+.
Optimizing the walk-forward setup itself. If you try different window sizes, step sizes, and objective functions until the walk-forward results look good — you've just overfitted the walk-forward analysis. Choose your window parameters based on practical considerations (data availability, strategy frequency) and stick with them.
Walk-forward analysis builds on the foundation of proper backtest setup and ties directly into understanding how to avoid overfitting. Master all three and you're ahead of 95% of retail traders.
"A strategy that hasn't been walk-forward tested is a hypothesis. A strategy that has been walk-forward tested and passed is an investment thesis. There's a world of difference." — Robert Pardo, The Evaluation and Optimization of Trading Strategies
Validate your strategy with the rigor it deserves. StratBase.ai supports walk-forward optimization with configurable window sizes, automatic parameter tracking, and WFE calculation.
FAQ
What is walk-forward analysis in trading?
WFA divides data into overlapping windows. Each window optimizes on an in-sample portion and tests on the next out-of-sample portion. Out-of-sample results are stitched together for a realistic performance estimate.
How many walk-forward windows do I need?
Minimum 6-8 for reliability. 12-20 is better but requires more data. Each window's out-of-sample portion should have 30+ trades.
Further Reading
About the Author
Financial data analyst focused on crypto derivatives and on-chain metrics. Expert in futures market microstructure and funding rate strategies.
FAQ
What is walk-forward analysis in trading?▾
Walk-forward analysis (WFA) divides historical data into multiple overlapping windows. For each window, the strategy is optimized on an 'in-sample' portion and then tested on a fresh 'out-of-sample' portion. The out-of-sample results are stitched together to create a realistic performance estimate.
How many walk-forward windows do I need?▾
A minimum of 6-8 windows is recommended for statistical reliability. More windows (12-20) provide better estimates but require longer data history. Each window should contain enough trades for statistical significance — typically 30+ trades in the out-of-sample portion.
Further reading
Related articles
Comments (0)
Loading comments...